How to create stackplots with Matplotlib.
Stackplots are generated by plotting different datasets vertically on top of one another rather than overlapping with one another. Below we show some examples to accomplish this with Matplotlib.
import numpy as np
import matplotlib.pyplot as plt
x = [1, 2, 3, 4, 5]
y1 = [1, 1, 2, 3, 5]
y2 = [0, 4, 2, 6, 8]
y3 = [1, 3, 5, 7, 9]
y = np.vstack([y1, y2, y3])
labels = ["Fibonacci ", "Evens", "Odds"]
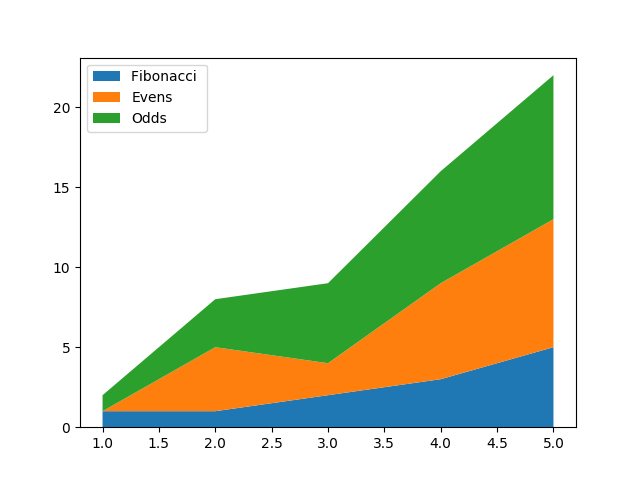
fig, ax = plt.subplots()
ax.stackplot(x, y1, y2, y3, labels=labels)
ax.legend(loc=2)
plt.show()
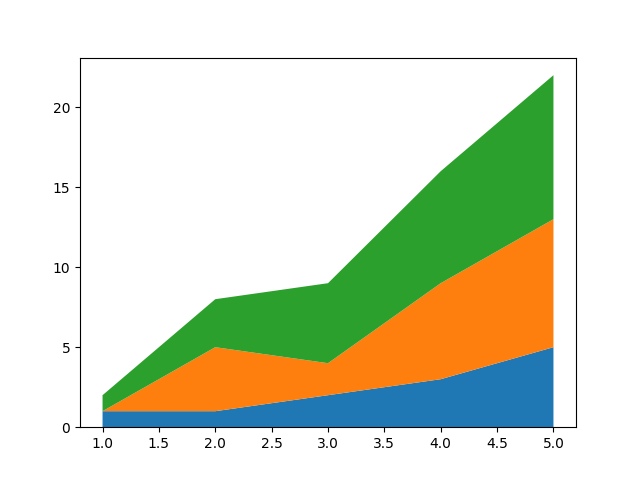
fig, ax = plt.subplots()
ax.stackplot(x, y)
plt.show()
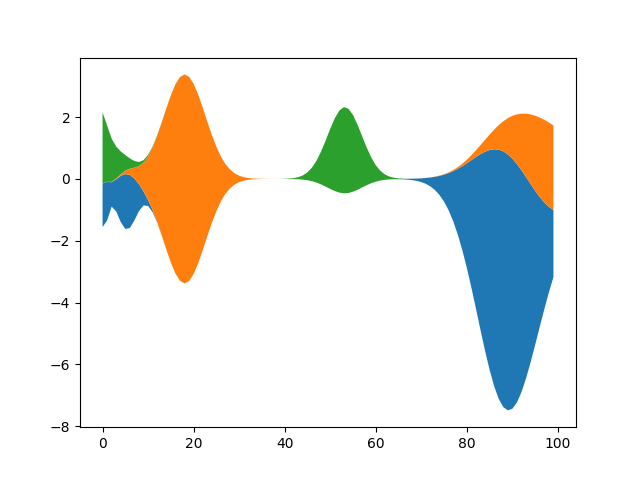
Here we show an example of making a streamgraph using stackplot
def layers(n, m):
    """
    Return *n* random Gaussian mixtures, each of length *m*.
    """
    def bump(a):
        x = 1 / (.1 + np.random.random())
        y = 2 * np.random.random() - .5
        z = 10 / (.1 + np.random.random())
        for i in range(m):
            w = (i / float(m) - y) * z
            a[i] += x * np.exp(-w * w)
    a = np.zeros((m, n))
    for i in range(n):
        for j in range(5):
            bump(a[:, i])
    return a


d = layers(3, 100)

fig, ax = plt.subplots()
ax.stackplot(range(100), d.T, baseline='wiggle')
plt.show()
Total running time of the script: ( 0 minutes 0.059 seconds)
