

"""
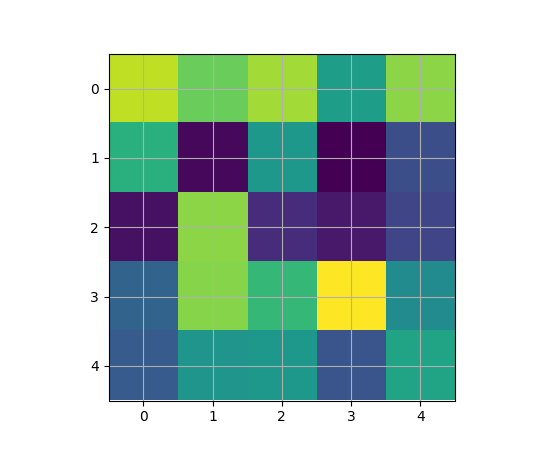
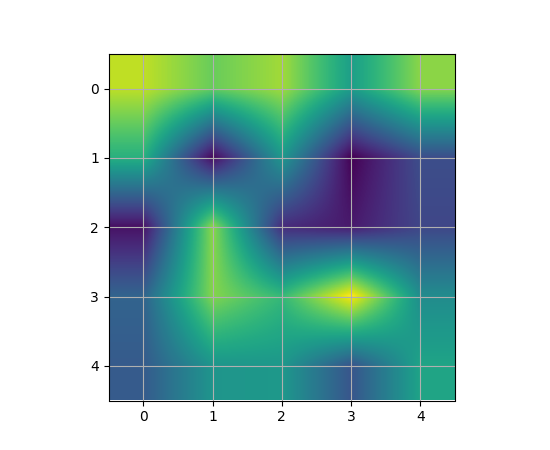
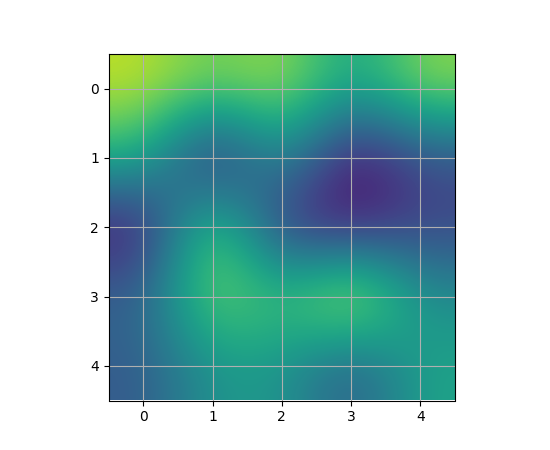
The same (small) array, interpolated with three different
interpolation methods.
The center of the pixel at A[i,j] is plotted at i+0.5, i+0.5. If you
are using interpolation='nearest', the region bounded by (i,j) and
(i+1,j+1) will have the same color. If you are using interpolation,
the pixel center will have the same color as it does with nearest, but
other pixels will be interpolated between the neighboring pixels.
Earlier versions of matplotlib (<0.63) tried to hide the edge effects
from you by setting the view limits so that they would not be visible.
A recent bugfix in antigrain, and a new implementation in the
matplotlib._image module which takes advantage of this fix, no longer
makes this necessary. To prevent edge effects, when doing
interpolation, the matplotlib._image module now pads the input array
with identical pixels around the edge. e.g., if you have a 5x5 array
with colors a-y as below
a b c d e
f g h i j
k l m n o
p q r s t
u v w x y
the _image module creates the padded array,
a a b c d e e
a a b c d e e
f f g h i j j
k k l m n o o
p p q r s t t
o u v w x y y
o u v w x y y
does the interpolation/resizing, and then extracts the central region.
This allows you to plot the full range of your array w/o edge effects,
and for example to layer multiple images of different sizes over one
another with different interpolation methods - see
examples/layer_images.py. It also implies a performance hit, as this
new temporary, padded array must be created. Sophisticated
interpolation also implies a performance hit, so if you need maximal
performance or have very large images, interpolation='nearest' is
suggested.
"""
import matplotlib.pyplot as plt
import numpy as np
A = np.random.rand(5, 5)
plt.figure(1)
plt.imshow(A, interpolation='nearest')
plt.grid(True)
plt.figure(2)
plt.imshow(A, interpolation='bilinear')
plt.grid(True)
plt.figure(3)
plt.imshow(A, interpolation='bicubic')
plt.grid(True)
plt.show()
Keywords: python, matplotlib, pylab, example, codex (see Search examples)