

(Source code, png, pdf)
from __future__ import print_function
import matplotlib.pyplot as plt
import numpy as np
import matplotlib.cbook as cbook
w, h = 512, 512
datafile = cbook.get_sample_data('ct.raw.gz', asfileobj=True)
s = datafile.read()
A = np.fromstring(s, np.uint16).astype(float)
A *= 1.0 / max(A)
A.shape = w, h
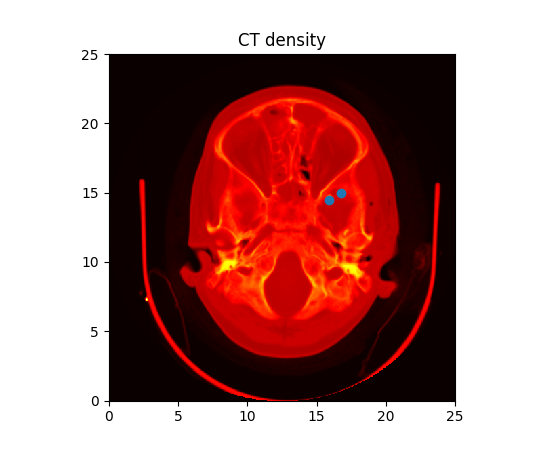
extent = (0, 25, 0, 25)
im = plt.imshow(A, cmap=plt.cm.hot, origin='upper', extent=extent)
markers = [(15.9, 14.5), (16.8, 15)]
x, y = zip(*markers)
plt.plot(x, y, 'o')
plt.title('CT density')
plt.show()
Keywords: python, matplotlib, pylab, example, codex (see Search examples)