

(Source code, png, pdf)
"""
Some people prefer to write more pythonic, object-oriented code
rather than use the pyplot interface to matplotlib. This example shows
you how.
Unless you are an application developer, I recommend using part of the
pyplot interface, particularly the figure, close, subplot, axes, and
show commands. These hide a lot of complexity from you that you don't
need to see in normal figure creation, like instantiating DPI
instances, managing the bounding boxes of the figure elements,
creating and realizing GUI windows and embedding figures in them.
If you are an application developer and want to embed matplotlib in
your application, follow the lead of examples/embedding_in_wx.py,
examples/embedding_in_gtk.py or examples/embedding_in_tk.py. In this
case you will want to control the creation of all your figures,
embedding them in application windows, etc.
If you are a web application developer, you may want to use the
example in webapp_demo.py, which shows how to use the backend agg
figure canvas directly, with none of the globals (current figure,
current axes) that are present in the pyplot interface. Note that
there is no reason why the pyplot interface won't work for web
application developers, however.
If you see an example in the examples dir written in pyplot interface,
and you want to emulate that using the true python method calls, there
is an easy mapping. Many of those examples use 'set' to control
figure properties. Here's how to map those commands onto instance
methods
The syntax of set is
plt.setp(object or sequence, somestring, attribute)
if called with an object, set calls
object.set_somestring(attribute)
if called with a sequence, set does
for object in sequence:
object.set_somestring(attribute)
So for your example, if a is your axes object, you can do
a.set_xticklabels([])
a.set_yticklabels([])
a.set_xticks([])
a.set_yticks([])
"""
from matplotlib.pyplot import figure, show
from numpy import arange, sin, pi
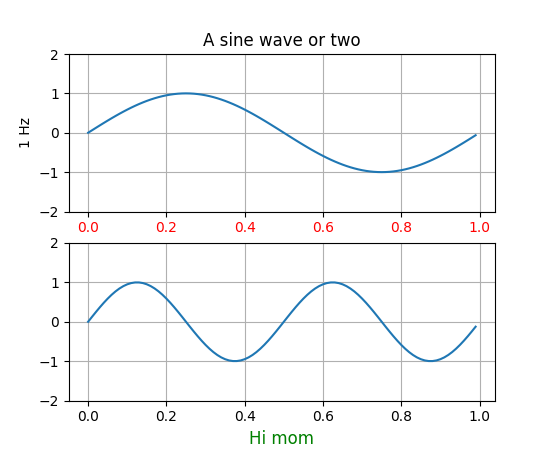
t = arange(0.0, 1.0, 0.01)
fig = figure(1)
ax1 = fig.add_subplot(211)
ax1.plot(t, sin(2*pi*t))
ax1.grid(True)
ax1.set_ylim((-2, 2))
ax1.set_ylabel('1 Hz')
ax1.set_title('A sine wave or two')
for label in ax1.get_xticklabels():
label.set_color('r')
ax2 = fig.add_subplot(212)
ax2.plot(t, sin(2*2*pi*t))
ax2.grid(True)
ax2.set_ylim((-2, 2))
l = ax2.set_xlabel('Hi mom')
l.set_color('g')
l.set_fontsize('large')
show()
Keywords: python, matplotlib, pylab, example, codex (see Search examples)