

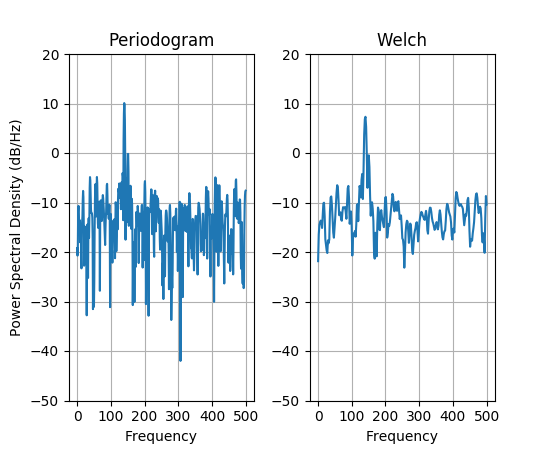
(Source code, png, pdf)

"""This is a ported version of a MATLAB example from the signal
processing toolbox that showed some difference at one time between
Matplotlib's and MATLAB's scaling of the PSD.

"""

import numpy as np
import matplotlib.pyplot as plt
import matplotlib.mlab as mlab

prng = np.random.RandomState(123456)  # to ensure reproducibility

fs = 1000
t = np.linspace(0, 0.3, 301)
A = np.array([2, 8]).reshape(-1, 1)
f = np.array([150, 140]).reshape(-1, 1)
xn = (A * np.sin(2 * np.pi * f * t)).sum(axis=0) + 5 * prng.randn(*t.shape)

fig, (ax0, ax1) = plt.subplots(ncols=2)

fig.subplots_adjust(hspace=0.45, wspace=0.3)
yticks = np.arange(-50, 30, 10)
yrange = (yticks[0], yticks[-1])
xticks = np.arange(0, 550, 100)

ax0.psd(xn, NFFT=301, Fs=fs, window=mlab.window_none, pad_to=1024,
        scale_by_freq=True)
ax0.set_title('Periodogram')
ax0.set_yticks(yticks)
ax0.set_xticks(xticks)
ax0.grid(True)
ax0.set_ylim(yrange)

ax1.psd(xn, NFFT=150, Fs=fs, window=mlab.window_none, pad_to=512, noverlap=75,
        scale_by_freq=True)
ax1.set_title('Welch')
ax1.set_xticks(xticks)
ax1.set_yticks(yticks)
ax1.set_ylabel('')  # overwrite the y-label added by `psd`
ax1.grid(True)
ax1.set_ylim(yrange)

plt.show()
Keywords: python, matplotlib, pylab, example, codex (see Search examples)