

(Source code, png, pdf)
import matplotlib.pyplot as plt
import numpy as np
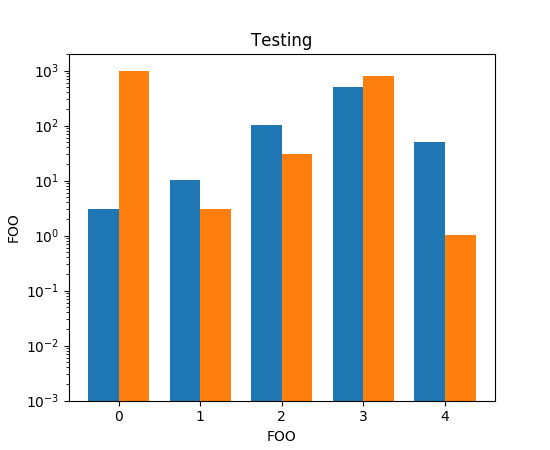
data = ((3, 1000), (10, 3), (100, 30), (500, 800), (50, 1))
plt.xlabel("FOO")
plt.ylabel("FOO")
plt.title("Testing")
plt.yscale('log')
dim = len(data[0])
w = 0.75
dimw = w / dim
x = np.arange(len(data))
for i in range(len(data[0])):
y = [d[i] for d in data]
b = plt.bar(x + i * dimw, y, dimw, bottom=0.001)
plt.xticks(x + dimw / 2, map(str, x))
plt.show()
Keywords: python, matplotlib, pylab, example, codex (see Search examples)