

(Source code, png, pdf)

from __future__ import print_function
from matplotlib import mlab
import matplotlib.pyplot as plt
import matplotlib.cbook as cbook
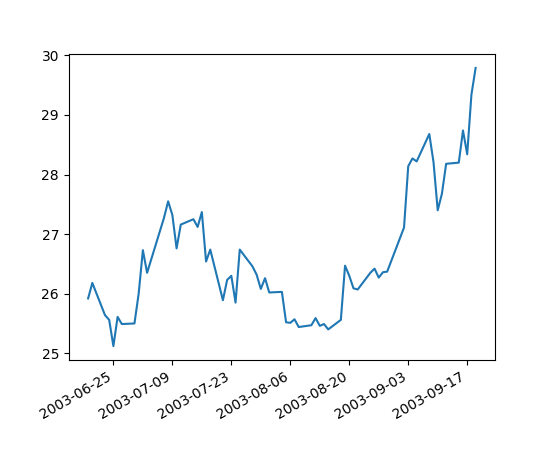
datafile = cbook.get_sample_data('msft.csv', asfileobj=False)
print('loading', datafile)
a = mlab.csv2rec(datafile)
a.sort()
print(a.dtype)
fig = plt.figure()
ax = fig.add_subplot(111)
ax.plot(a.date, a.adj_close, '-')
fig.autofmt_xdate()
# if you have xlwt installed, you can output excel
try:
import mpl_toolkits.exceltools as exceltools
exceltools.rec2excel(a, 'test.xls')
except ImportError:
pass
plt.show()
Keywords: python, matplotlib, pylab, example, codex (see Search examples)