

(Source code, png, pdf)
"""
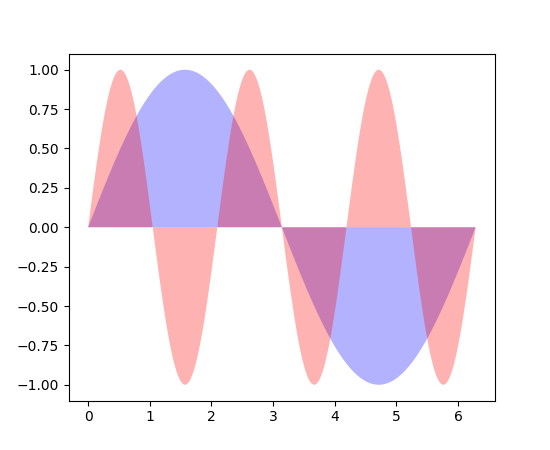
========================
A more complex fill demo
========================
In addition to the basic fill plot, this demo shows a few optional features:
* Multiple curves with a single command.
* Setting the fill color.
* Setting the opacity (alpha value).
"""
import numpy as np
import matplotlib.pyplot as plt
x = np.linspace(0, 2 * np.pi, 500)
y1 = np.sin(x)
y2 = np.sin(3 * x)
fig, ax = plt.subplots()
ax.fill(x, y1, 'b', x, y2, 'r', alpha=0.3)
plt.show()
Keywords: python, matplotlib, pylab, example, codex (see Search examples)