

(Source code, png, pdf)

"""
==================
A simple Fill plot
==================
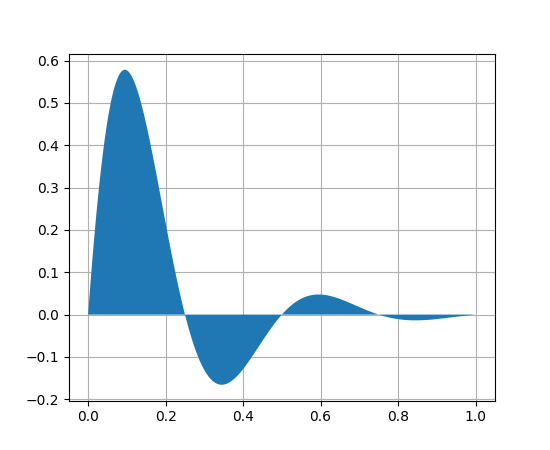
This example showcases the most basic fill plot a user can do with matplotlib.
"""
import numpy as np
import matplotlib.pyplot as plt
x = np.linspace(0, 1, 500)
y = np.sin(4 * np.pi * x) * np.exp(-5 * x)
fig, ax = plt.subplots()
ax.fill(x, y, zorder=10)
ax.grid(True, zorder=5)
plt.show()
Keywords: python, matplotlib, pylab, example, codex (see Search examples)