

import matplotlib.pyplot as plt
import numpy.random as rnd
fig = plt.figure()
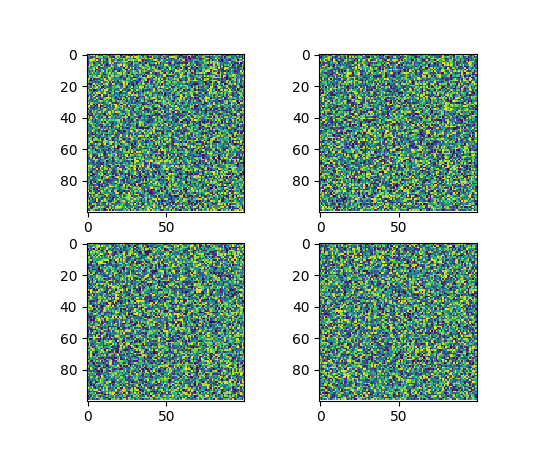
plt.subplot(221)
plt.imshow(rnd.random((100, 100)))
plt.subplot(222)
plt.imshow(rnd.random((100, 100)))
plt.subplot(223)
plt.imshow(rnd.random((100, 100)))
plt.subplot(224)
plt.imshow(rnd.random((100, 100)))
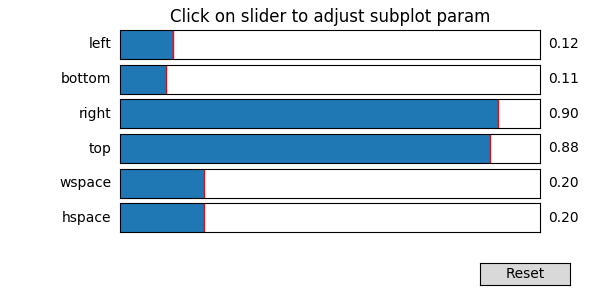
plt.subplot_tool()
plt.show()
Keywords: python, matplotlib, pylab, example, codex (see Search examples)
