

(Source code, png, pdf)
import numpy as np
import matplotlib.pyplot as plt
np.random.seed(0)
def layers(n, m):
"""
Return *n* random Gaussian mixtures, each of length *m*.
"""
def bump(a):
x = 1 / (.1 + np.random.random())
y = 2 * np.random.random() - .5
z = 10 / (.1 + np.random.random())
for i in range(m):
w = (i / float(m) - y) * z
a[i] += x * np.exp(-w * w)
a = np.zeros((m, n))
for i in range(n):
for j in range(5):
bump(a[:, i])
return a
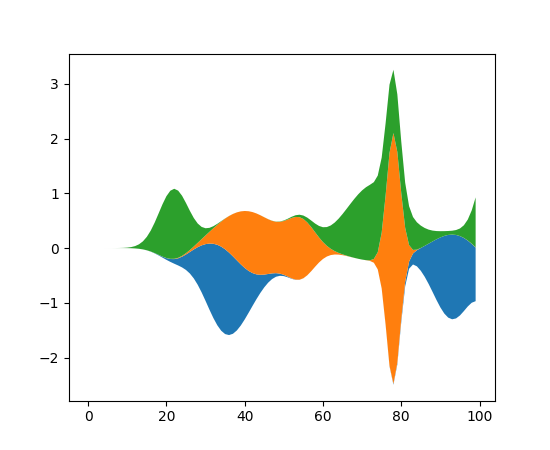
d = layers(3, 100)
plt.subplots()
plt.stackplot(range(100), d.T, baseline='wiggle')
plt.show()
Keywords: python, matplotlib, pylab, example, codex (see Search examples)