

(Source code, png, pdf)
import matplotlib.pyplot as plt
import numpy as np
np.random.seed(0)
dt = 0.01
Fs = 1/dt
t = np.arange(0, 10, dt)
nse = np.random.randn(len(t))
r = np.exp(-t/0.05)
cnse = np.convolve(nse, r)*dt
cnse = cnse[:len(t)]
s = 0.1*np.sin(2*np.pi*t) + cnse
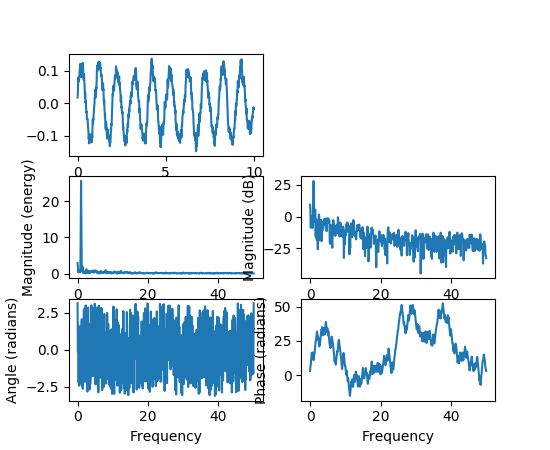
plt.subplot(3, 2, 1)
plt.plot(t, s)
plt.subplot(3, 2, 3)
plt.magnitude_spectrum(s, Fs=Fs)
plt.subplot(3, 2, 4)
plt.magnitude_spectrum(s, Fs=Fs, scale='dB')
plt.subplot(3, 2, 5)
plt.angle_spectrum(s, Fs=Fs)
plt.subplot(3, 2, 6)
plt.phase_spectrum(s, Fs=Fs)
plt.show()
Keywords: python, matplotlib, pylab, example, codex (see Search examples)