

(Source code, png, pdf)
import matplotlib.pyplot as plt
import numpy as np
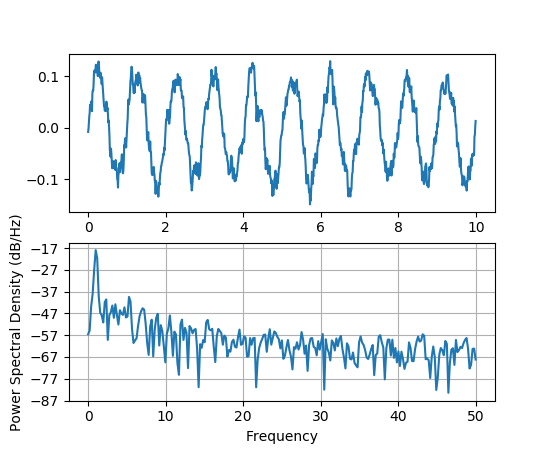
dt = 0.01
t = np.arange(0, 10, dt)
nse = np.random.randn(len(t))
r = np.exp(-t/0.05)
cnse = np.convolve(nse, r)*dt
cnse = cnse[:len(t)]
s = 0.1*np.sin(2*np.pi*t) + cnse
plt.subplot(211)
plt.plot(t, s)
plt.subplot(212)
plt.psd(s, 512, 1/dt)
plt.show()
"""
% compare with MATLAB
dt = 0.01;
t = [0:dt:10];
nse = randn(size(t));
r = exp(-t/0.05);
cnse = conv(nse, r)*dt;
cnse = cnse(1:length(t));
s = 0.1*sin(2*pi*t) + cnse;
subplot(211)
plot(t,s)
subplot(212)
psd(s, 512, 1/dt)
"""
Keywords: python, matplotlib, pylab, example, codex (see Search examples)