

import matplotlib.pyplot as plt
import numpy as np
from matplotlib.ticker import OldScalarFormatter, ScalarFormatter
# Example 1
x = np.arange(0, 1, .01)
fig, [[ax1, ax2], [ax3, ax4]] = plt.subplots(2, 2, figsize=(6, 6))
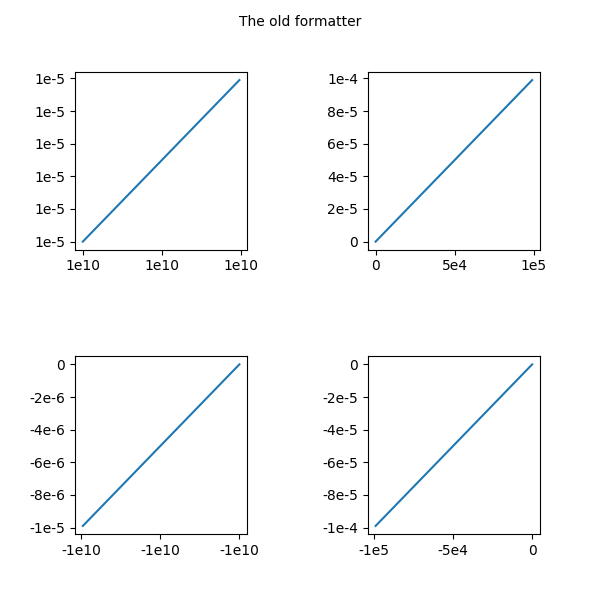
fig.text(0.5, 0.975, 'The old formatter',
horizontalalignment='center', verticalalignment='top')
ax1.plot(x * 1e5 + 1e10, x * 1e-10 + 1e-5)
ax1.xaxis.set_major_formatter(OldScalarFormatter())
ax1.yaxis.set_major_formatter(OldScalarFormatter())
ax2.plot(x * 1e5, x * 1e-4)
ax2.xaxis.set_major_formatter(OldScalarFormatter())
ax2.yaxis.set_major_formatter(OldScalarFormatter())
ax3.plot(-x * 1e5 - 1e10, -x * 1e-5 - 1e-10)
ax3.xaxis.set_major_formatter(OldScalarFormatter())
ax3.yaxis.set_major_formatter(OldScalarFormatter())
ax4.plot(-x * 1e5, -x * 1e-4)
ax4.xaxis.set_major_formatter(OldScalarFormatter())
ax4.yaxis.set_major_formatter(OldScalarFormatter())
fig.subplots_adjust(wspace=0.7, hspace=0.6)
# Example 2
x = np.arange(0, 1, .01)
fig, [[ax1, ax2], [ax3, ax4]] = plt.subplots(2, 2, figsize=(6, 6))
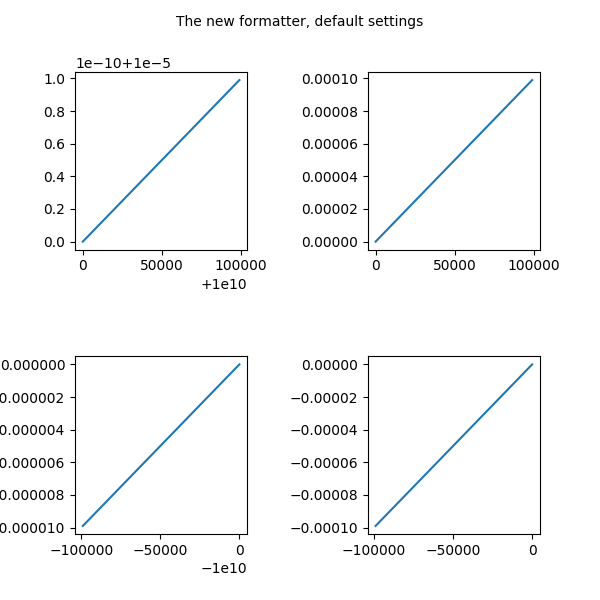
fig.text(0.5, 0.975, 'The new formatter, default settings',
horizontalalignment='center',
verticalalignment='top')
ax1.plot(x * 1e5 + 1e10, x * 1e-10 + 1e-5)
ax1.xaxis.set_major_formatter(ScalarFormatter())
ax1.yaxis.set_major_formatter(ScalarFormatter())
ax2.plot(x * 1e5, x * 1e-4)
ax2.xaxis.set_major_formatter(ScalarFormatter())
ax2.yaxis.set_major_formatter(ScalarFormatter())
ax3.plot(-x * 1e5 - 1e10, -x * 1e-5 - 1e-10)
ax3.xaxis.set_major_formatter(ScalarFormatter())
ax3.yaxis.set_major_formatter(ScalarFormatter())
ax4.plot(-x * 1e5, -x * 1e-4)
ax4.xaxis.set_major_formatter(ScalarFormatter())
ax4.yaxis.set_major_formatter(ScalarFormatter())
fig.subplots_adjust(wspace=0.7, hspace=0.6)
# Example 3
x = np.arange(0, 1, .01)
fig, [[ax1, ax2], [ax3, ax4]] = plt.subplots(2, 2, figsize=(6, 6))
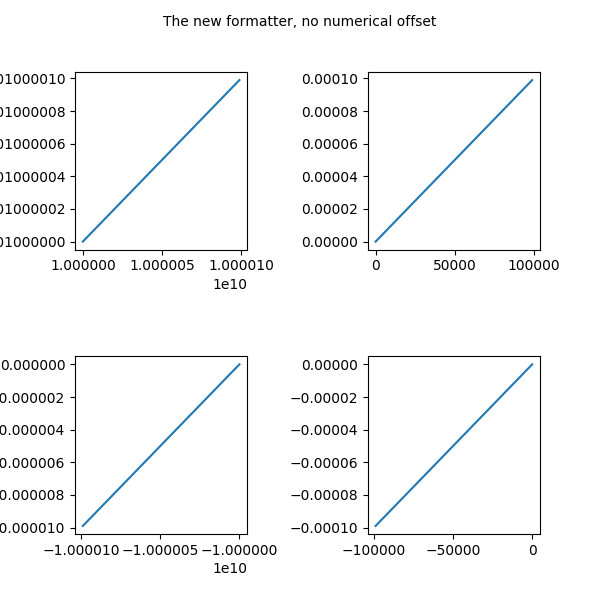
fig.text(0.5, 0.975, 'The new formatter, no numerical offset',
horizontalalignment='center',
verticalalignment='top')
ax1.plot(x * 1e5 + 1e10, x * 1e-10 + 1e-5)
ax1.xaxis.set_major_formatter(ScalarFormatter(useOffset=False))
ax1.yaxis.set_major_formatter(ScalarFormatter(useOffset=False))
ax2.plot(x * 1e5, x * 1e-4)
ax2.xaxis.set_major_formatter(ScalarFormatter(useOffset=False))
ax2.yaxis.set_major_formatter(ScalarFormatter(useOffset=False))
ax3.plot(-x * 1e5 - 1e10, -x * 1e-5 - 1e-10)
ax3.xaxis.set_major_formatter(ScalarFormatter(useOffset=False))
ax3.yaxis.set_major_formatter(ScalarFormatter(useOffset=False))
ax4.plot(-x * 1e5, -x * 1e-4)
ax4.xaxis.set_major_formatter(ScalarFormatter(useOffset=False))
ax4.yaxis.set_major_formatter(ScalarFormatter(useOffset=False))
fig.subplots_adjust(wspace=0.7, hspace=0.6)
# Example 4
x = np.arange(0, 1, .01)
fig, [[ax1, ax2], [ax3, ax4]] = plt.subplots(2, 2, figsize=(6, 6))
fig.text(0.5, 0.975, 'The new formatter, with mathtext',
horizontalalignment='center',
verticalalignment='top')
ax1.plot(x * 1e5 + 1e10, x * 1e-10 + 1e-5)
ax1.xaxis.set_major_formatter(ScalarFormatter(useMathText=True))
ax1.yaxis.set_major_formatter(ScalarFormatter(useMathText=True))
ax2.plot(x * 1e5, x * 1e-4)
ax2.xaxis.set_major_formatter(ScalarFormatter(useMathText=True))
ax2.yaxis.set_major_formatter(ScalarFormatter(useMathText=True))
ax3.plot(-x * 1e5 - 1e10, -x * 1e-5 - 1e-10)
ax3.xaxis.set_major_formatter(ScalarFormatter(useMathText=True))
ax3.yaxis.set_major_formatter(ScalarFormatter(useMathText=True))
ax4.plot(-x * 1e5, -x * 1e-4)
ax4.xaxis.set_major_formatter(ScalarFormatter(useMathText=True))
ax4.yaxis.set_major_formatter(ScalarFormatter(useMathText=True))
fig.subplots_adjust(wspace=0.7, hspace=0.6)
plt.show()
Keywords: python, matplotlib, pylab, example, codex (see Search examples)

