

(Source code, png, pdf)
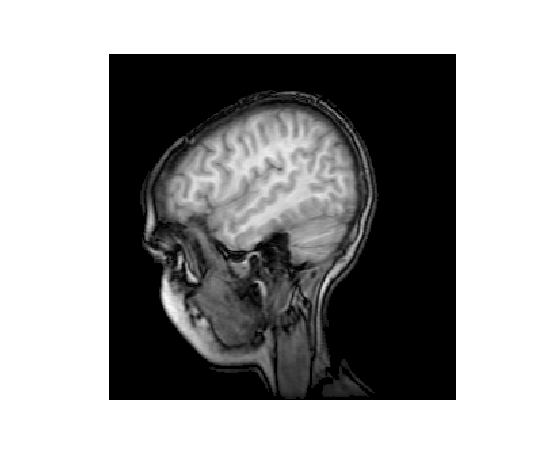
"""Displays an MRI image."""

import matplotlib.pyplot as plt
import matplotlib.cbook as cbook
import matplotlib.cm as cm
import numpy as np

fig, ax = plt.subplots(num="MRI_demo")

# Data are 256x256 16 bit integers
dfile = cbook.get_sample_data('s1045.ima.gz')
im = np.fromstring(dfile.read(), np.uint16).astype(float)
im.shape = (256, 256)
dfile.close()

ax.imshow(im, cmap=cm.gray)
ax.axis('off')

plt.show()
Keywords: python, matplotlib, pylab, example, codex (see Search examples)