

(Source code, png, pdf)

'''
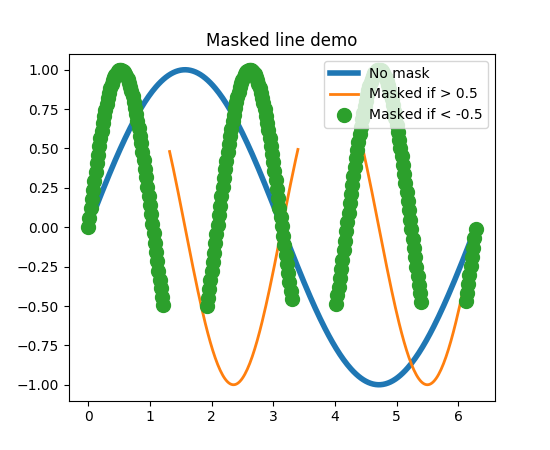
Plot lines with points masked out.
This would typically be used with gappy data, to
break the line at the data gaps.
'''
import matplotlib.pyplot as plt
import numpy as np
x = np.arange(0, 2*np.pi, 0.02)
y = np.sin(x)
y1 = np.sin(2*x)
y2 = np.sin(3*x)
ym1 = np.ma.masked_where(y1 > 0.5, y1)
ym2 = np.ma.masked_where(y2 < -0.5, y2)
lines = plt.plot(x, y, x, ym1, x, ym2, 'o')
plt.setp(lines[0], linewidth=4)
plt.setp(lines[1], linewidth=2)
plt.setp(lines[2], markersize=10)
plt.legend(('No mask', 'Masked if > 0.5', 'Masked if < -0.5'),
loc='upper right')
plt.title('Masked line demo')
plt.show()
Keywords: python, matplotlib, pylab, example, codex (see Search examples)