

(Source code, png, pdf)
"""
The techniques here are no longer required with the new support for
spines in matplotlib -- see
http://matplotlib.org/examples/pylab_examples/spine_placement_demo.html.
This example should be considered deprecated and is left just for demo
purposes for folks wanting to make a pseudo-axis
"""
import numpy as np
import matplotlib.pyplot as plt
import matplotlib.lines as lines
def make_xaxis(ax, yloc, offset=0.05, **props):
xmin, xmax = ax.get_xlim()
locs = [loc for loc in ax.xaxis.get_majorticklocs()
if loc >= xmin and loc <= xmax]
tickline, = ax.plot(locs, [yloc]*len(locs), linestyle='',
marker=lines.TICKDOWN, **props)
axline, = ax.plot([xmin, xmax], [yloc, yloc], **props)
tickline.set_clip_on(False)
axline.set_clip_on(False)
for loc in locs:
ax.text(loc, yloc - offset, '%1.1f' % loc,
horizontalalignment='center',
verticalalignment='top')
def make_yaxis(ax, xloc=0, offset=0.05, **props):
ymin, ymax = ax.get_ylim()
locs = [loc for loc in ax.yaxis.get_majorticklocs()
if loc >= ymin and loc <= ymax]
tickline, = ax.plot([xloc]*len(locs), locs, linestyle='',
marker=lines.TICKLEFT, **props)
axline, = ax.plot([xloc, xloc], [ymin, ymax], **props)
tickline.set_clip_on(False)
axline.set_clip_on(False)
for loc in locs:
ax.text(xloc - offset, loc, '%1.1f' % loc,
verticalalignment='center',
horizontalalignment='right')
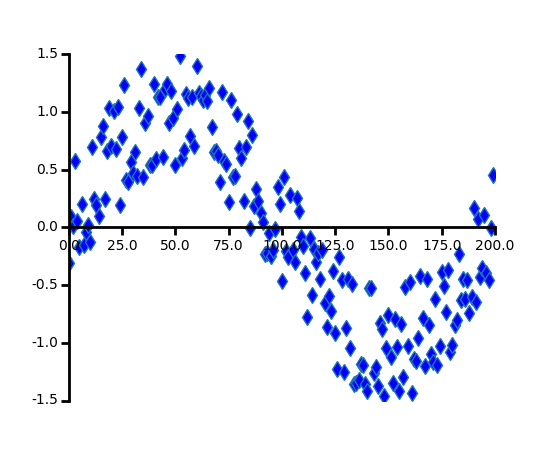
props = dict(color='black', linewidth=2, markeredgewidth=2)
x = np.arange(200.)
y = np.sin(2*np.pi*x/200.) + np.random.rand(200) - 0.5
fig = plt.figure(facecolor='white')
ax = fig.add_subplot(111, frame_on=False)
ax.axison = False
ax.plot(x, y, 'd', markersize=8, markerfacecolor='blue')
ax.set_xlim(0, 200)
ax.set_ylim(-1.5, 1.5)
make_xaxis(ax, 0, offset=0.1, **props)
make_yaxis(ax, 0, offset=5, **props)
plt.show()
Keywords: python, matplotlib, pylab, example, codex (see Search examples)