

(Source code, png, pdf)
from matplotlib.colors import LogNorm
import matplotlib.pyplot as plt
import numpy as np
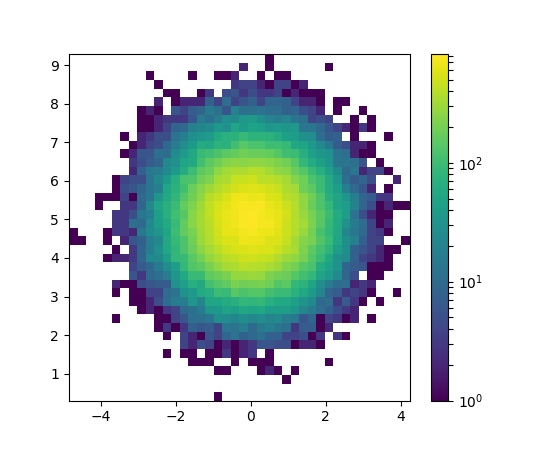
# normal distribution center at x=0 and y=5
x = np.random.randn(100000)
y = np.random.randn(100000) + 5
plt.hist2d(x, y, bins=40, norm=LogNorm())
plt.colorbar()
plt.show()
Keywords: python, matplotlib, pylab, example, codex (see Search examples)