

import matplotlib.pyplot as plt
plt.figure()
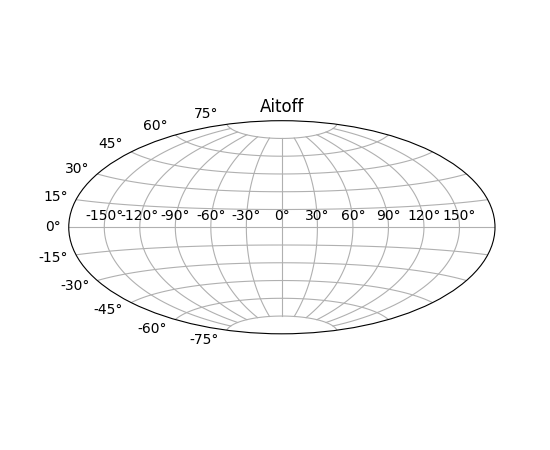
plt.subplot(111, projection="aitoff")
plt.title("Aitoff")
plt.grid(True)
plt.figure()
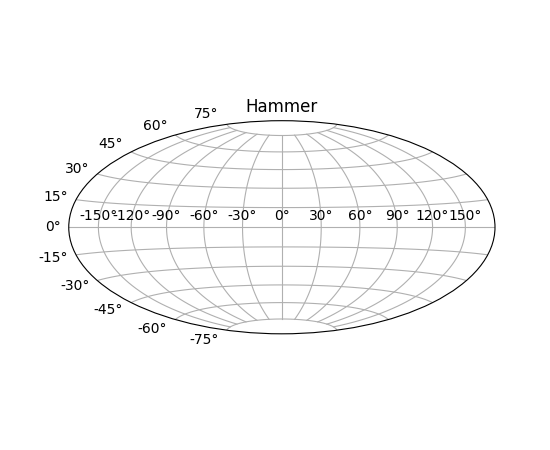
plt.subplot(111, projection="hammer")
plt.title("Hammer")
plt.grid(True)
plt.figure()
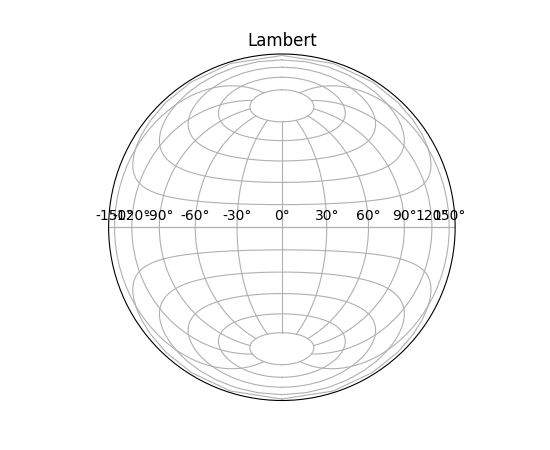
plt.subplot(111, projection="lambert")
plt.title("Lambert")
plt.grid(True)
plt.figure()
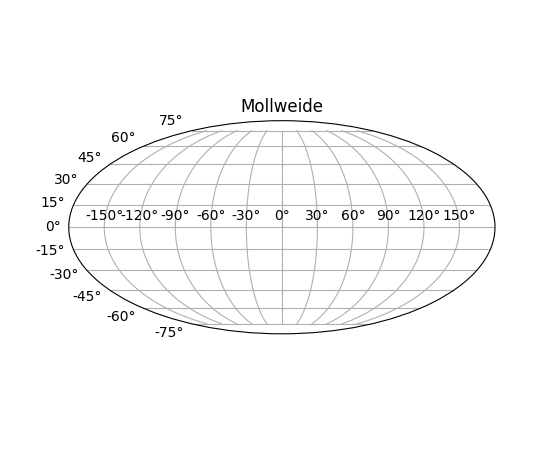
plt.subplot(111, projection="mollweide")
plt.title("Mollweide")
plt.grid(True)
plt.show()
Keywords: python, matplotlib, pylab, example, codex (see Search examples)
