

(Source code, png, pdf)
# override the default reporting of coords
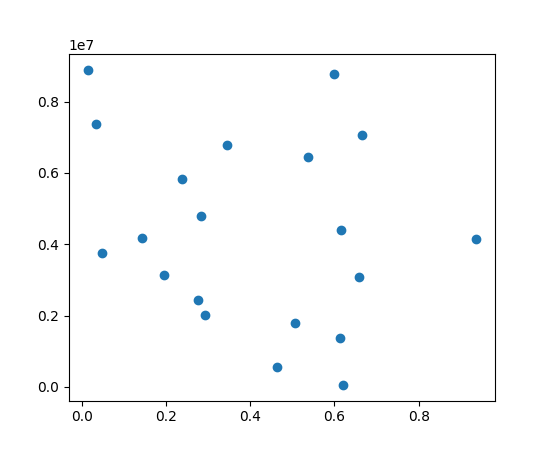
import matplotlib.pyplot as plt
import numpy as np
def millions(x):
return '$%1.1fM' % (x*1e-6)
x = np.random.rand(20)
y = 1e7*np.random.rand(20)
fig, ax = plt.subplots()
ax.fmt_ydata = millions
plt.plot(x, y, 'o')
plt.show()
Keywords: python, matplotlib, pylab, example, codex (see Search examples)