

(Source code, png, pdf)
from mpl_toolkits.mplot3d import Axes3D
import matplotlib.pyplot as plt
import numpy as np
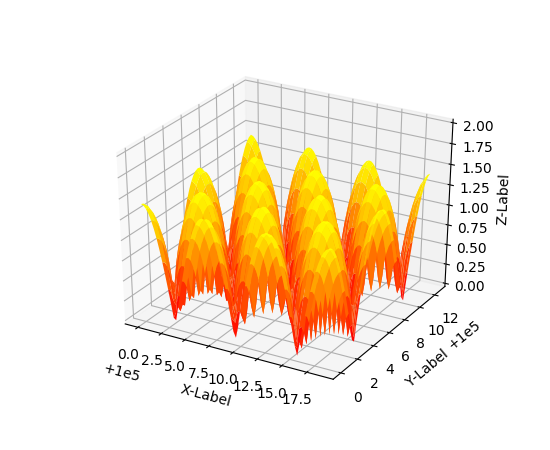
# This example demonstrates mplot3d's offset text display.
# As one rotates the 3D figure, the offsets should remain oriented
# same way as the axis label, and should also be located "away"
# from the center of the plot.
#
# This demo triggers the display of the offset text for the x and
# y axis by adding 1e5 to X and Y. Anything less would not
# automatically trigger it.
fig = plt.figure()
ax = fig.gca(projection='3d')
X, Y = np.mgrid[0:6*np.pi:0.25, 0:4*np.pi:0.25]
Z = np.sqrt(np.abs(np.cos(X) + np.cos(Y)))
surf = ax.plot_surface(X + 1e5, Y + 1e5, Z, cmap='autumn', cstride=2, rstride=2)
ax.set_xlabel("X-Label")
ax.set_ylabel("Y-Label")
ax.set_zlabel("Z-Label")
ax.set_zlim(0, 2)
plt.show()
Keywords: python, matplotlib, pylab, example, codex (see Search examples)