

(Source code, png, pdf)
from __future__ import print_function
import matplotlib.pyplot as plt
import numpy as np
ax = plt.axes([0.1, 0.3, 0.5, 0.5])
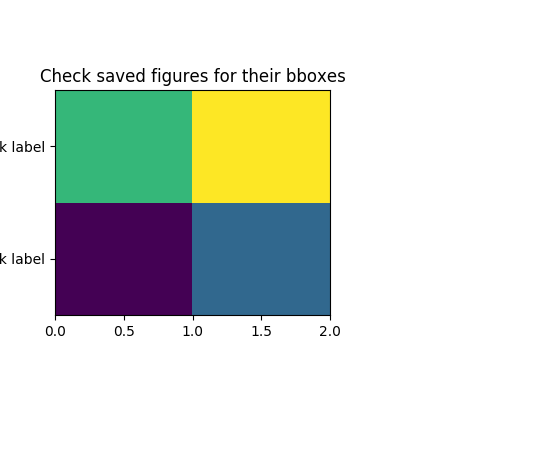
ax.pcolormesh(np.array([[1, 2], [3, 4]]))
plt.yticks([0.5, 1.5], ["long long tick label",
"tick label"])
plt.ylabel("My y-label")
plt.title("Check saved figures for their bboxes")
for ext in ["png", "pdf", "svg", "svgz", "eps"]:
print("saving tight_bbox_test.%s" % (ext,))
plt.savefig("tight_bbox_test.%s" % (ext,), bbox_inches="tight")
plt.show()
Keywords: python, matplotlib, pylab, example, codex (see Search examples)