

(Source code, png, pdf)
"""
===========================
Plots with different scales
===========================
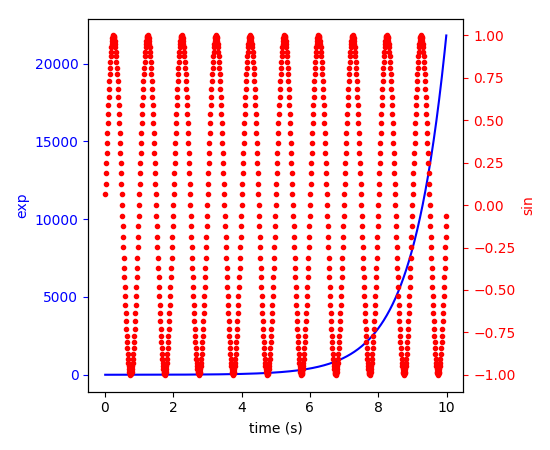
Demonstrate how to do two plots on the same axes with different left and
right scales.
The trick is to use *two different axes* that share the same *x* axis.
You can use separate `matplotlib.ticker` formatters and locators as
desired since the two axes are independent.
Such axes are generated by calling the `Axes.twinx` method. Likewise,
`Axes.twiny` is available to generate axes that share a *y* axis but
have different top and bottom scales.
The twinx and twiny methods are also exposed as pyplot functions.
"""
import numpy as np
import matplotlib.pyplot as plt
fig, ax1 = plt.subplots()
t = np.arange(0.01, 10.0, 0.01)
s1 = np.exp(t)
ax1.plot(t, s1, 'b-')
ax1.set_xlabel('time (s)')
# Make the y-axis label, ticks and tick labels match the line color.
ax1.set_ylabel('exp', color='b')
ax1.tick_params('y', colors='b')
ax2 = ax1.twinx()
s2 = np.sin(2 * np.pi * t)
ax2.plot(t, s2, 'r.')
ax2.set_ylabel('sin', color='r')
ax2.tick_params('y', colors='r')
fig.tight_layout()
plt.show()
Keywords: python, matplotlib, pylab, example, codex (see Search examples)