

(Source code, png, pdf)
"""
========================
Exploring normalizations
========================
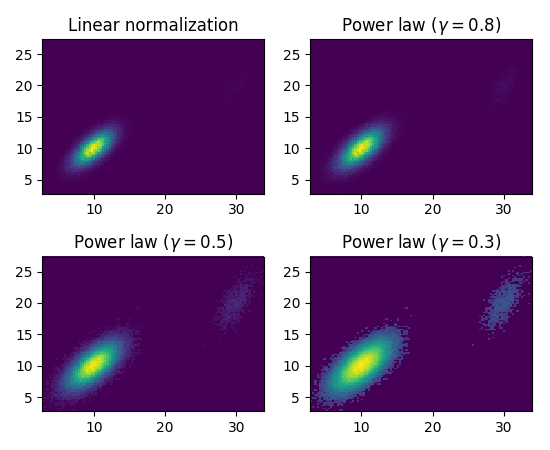
Let's explore various normalization on a multivariate normal distribution.
"""
from matplotlib import pyplot as plt
import matplotlib.colors as mcolors
import numpy as np
from numpy.random import multivariate_normal
data = np.vstack([
multivariate_normal([10, 10], [[3, 2], [2, 3]], size=100000),
multivariate_normal([30, 20], [[2, 3], [1, 3]], size=1000)
])
gammas = [0.8, 0.5, 0.3]
fig, axes = plt.subplots(nrows=2, ncols=2)
axes[0, 0].set_title('Linear normalization')
axes[0, 0].hist2d(data[:, 0], data[:, 1], bins=100)
for ax, gamma in zip(axes.flat[1:], gammas):
ax.set_title('Power law $(\gamma=%1.1f)$' % gamma)
ax.hist2d(data[:, 0], data[:, 1],
bins=100, norm=mcolors.PowerNorm(gamma))
fig.tight_layout()
plt.show()
Keywords: python, matplotlib, pylab, example, codex (see Search examples)