Learn what to expect in the new updates


(Source code, png, hires.png, pdf)

"""
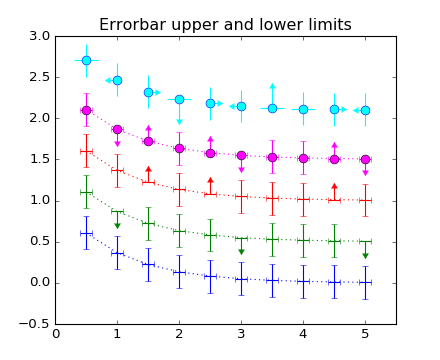
Demo of the errorbar function, including upper and lower limits
"""
import numpy as np
import matplotlib.pyplot as plt
# example data
x = np.arange(0.5, 5.5, 0.5)
y = np.exp(-x)
xerr = 0.1
yerr = 0.2
ls = 'dotted'
fig = plt.figure()
ax = fig.add_subplot(1, 1, 1)
# standard error bars
plt.errorbar(x, y, xerr=xerr, yerr=yerr, ls=ls, color='blue')
# including upper limits
uplims = np.zeros(x.shape)
uplims[[1, 5, 9]] = True
plt.errorbar(x, y + 0.5, xerr=xerr, yerr=yerr, uplims=uplims, ls=ls,
color='green')
# including lower limits
lolims = np.zeros(x.shape)
lolims[[2, 4, 8]] = True
plt.errorbar(x, y + 1.0, xerr=xerr, yerr=yerr, lolims=lolims, ls=ls,
color='red')
# including upper and lower limits
plt.errorbar(x, y + 1.5, marker='o', ms=8, xerr=xerr, yerr=yerr,
lolims=lolims, uplims=uplims, ls=ls, color='magenta')
# including xlower and xupper limits
xerr = 0.2
yerr = np.zeros(x.shape) + 0.2
yerr[[3, 6]] = 0.3
xlolims = lolims
xuplims = uplims
lolims = np.zeros(x.shape)
uplims = np.zeros(x.shape)
lolims[[6]] = True
uplims[[3]] = True
plt.errorbar(x, y + 2.1, marker='o', ms=8, xerr=xerr, yerr=yerr,
xlolims=xlolims, xuplims=xuplims, uplims=uplims, lolims=lolims,
ls='none', mec='blue', capsize=0, color='cyan')
ax.set_xlim((0, 5.5))
ax.set_title('Errorbar upper and lower limits')
plt.show()
Keywords: python, matplotlib, pylab, example, codex (see Search examples)