Learn what to expect in the new updates

(Source code, png, hires.png, pdf)

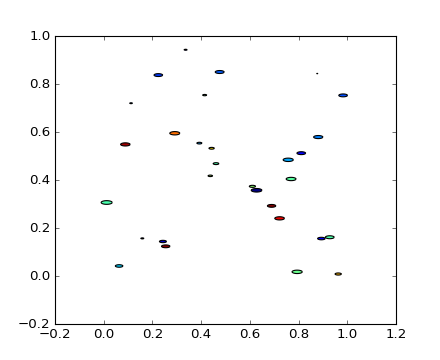
import matplotlib.pyplot as plt
from numpy import arange, pi, cos, sin
from numpy.random import rand

# unit area ellipse
rx, ry = 3., 1.
area = rx * ry * pi
theta = arange(0, 2*pi + 0.01, 0.1)
verts = list(zip(rx/area*cos(theta), ry/area*sin(theta)))

x, y, s, c = rand(4, 30)
s *= 10**2.

fig, ax = plt.subplots()
ax.scatter(x, y, s, c, marker=None, verts=verts)

plt.show()
Keywords: python, matplotlib, pylab, example, codex (see Search examples)