Learn what to expect in the new updates

"""
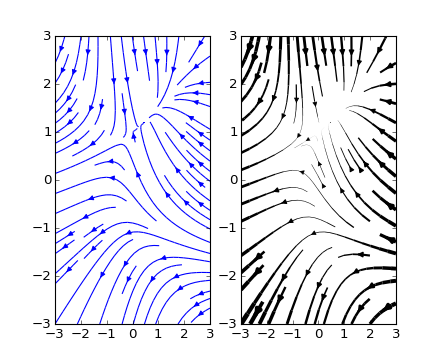
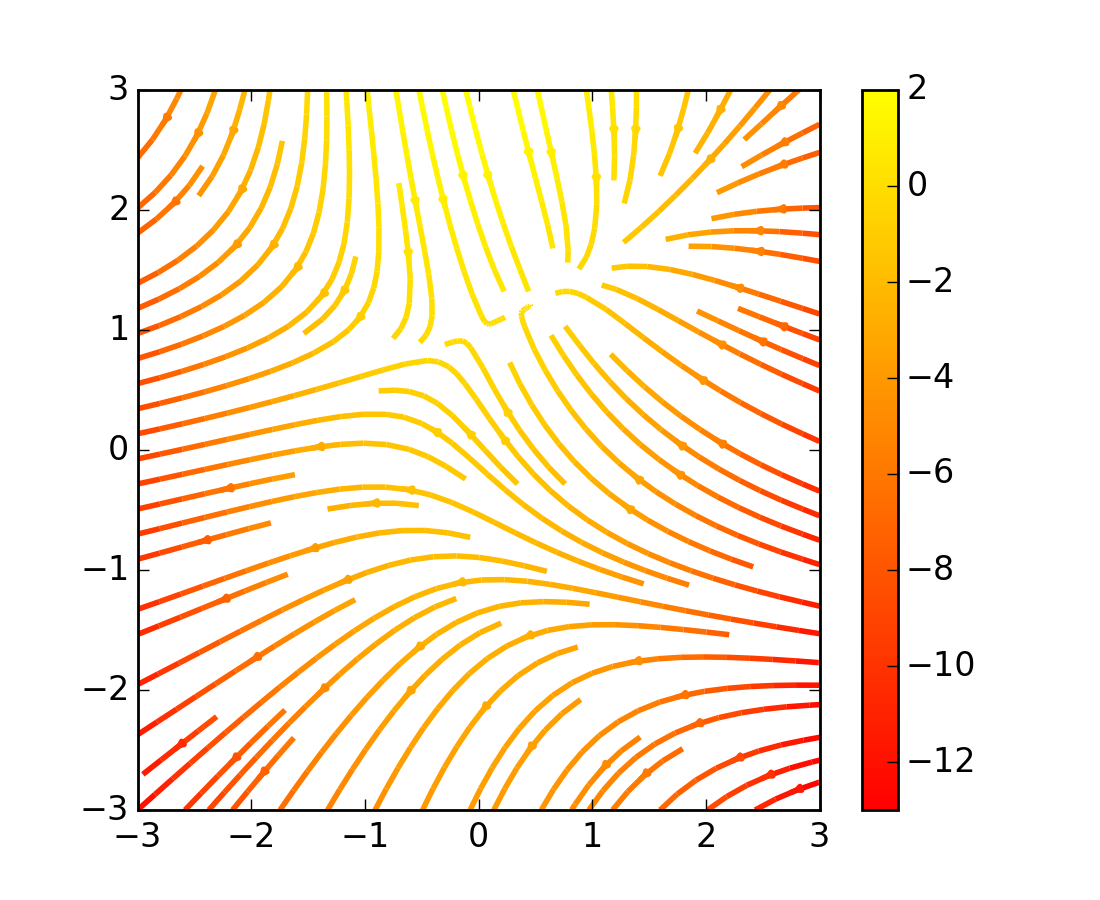
Demo of the `streamplot` function.
A streamplot, or streamline plot, is used to display 2D vector fields. This
example shows a few features of the stream plot function:
* Varying the color along a streamline.
* Varying the density of streamlines.
* Varying the line width along a stream line.
"""
import numpy as np
import matplotlib.pyplot as plt
Y, X = np.mgrid[-3:3:100j, -3:3:100j]
U = -1 - X**2 + Y
V = 1 + X - Y**2
speed = np.sqrt(U*U + V*V)
plt.streamplot(X, Y, U, V, color=U, linewidth=2, cmap=plt.cm.autumn)
plt.colorbar()
f, (ax1, ax2) = plt.subplots(ncols=2)
ax1.streamplot(X, Y, U, V, density=[0.5, 1])
lw = 5*speed/speed.max()
ax2.streamplot(X, Y, U, V, density=0.6, color='k', linewidth=lw)
plt.show()
Keywords: python, matplotlib, pylab, example, codex (see Search examples)
