Learn what to expect in the new updates

(Source code, png, hires.png, pdf)

"""
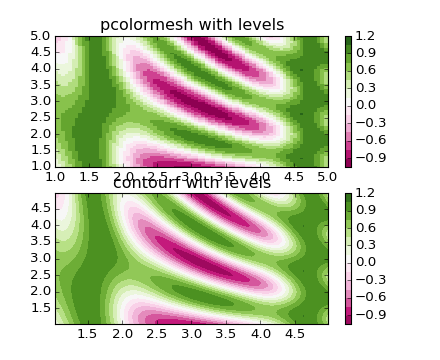
Shows how to combine Normalization and Colormap instances to draw
"levels" in pcolor, pcolormesh and imshow type plots in a similar
way to the levels keyword argument to contour/contourf.
"""
import matplotlib.pyplot as plt
from matplotlib.colors import BoundaryNorm
from matplotlib.ticker import MaxNLocator
import numpy as np
# make these smaller to increase the resolution
dx, dy = 0.05, 0.05
# generate 2 2d grids for the x & y bounds
y, x = np.mgrid[slice(1, 5 + dy, dy),
slice(1, 5 + dx, dx)]
z = np.sin(x) ** 10 + np.cos(10 + y * x) * np.cos(x)
# x and y are bounds, so z should be the value *inside* those bounds.
# Therefore, remove the last value from the z array.
z = z[:-1, :-1]
levels = MaxNLocator(nbins=15).tick_values(z.min(), z.max())
# pick the desired colormap, sensible levels, and define a normalization
# instance which takes data values and translates those into levels.
cmap = plt.get_cmap('PiYG')
norm = BoundaryNorm(levels, ncolors=cmap.N, clip=True)
plt.subplot(2, 1, 1)
im = plt.pcolormesh(x, y, z, cmap=cmap, norm=norm)
plt.colorbar()
# set the limits of the plot to the limits of the data
plt.axis([x.min(), x.max(), y.min(), y.max()])
plt.title('pcolormesh with levels')
plt.subplot(2, 1, 2)
# contours are *point* based plots, so convert our bound into point
# centers
plt.contourf(x[:-1, :-1] + dx / 2.,
y[:-1, :-1] + dy / 2., z, levels=levels,
cmap=cmap)
plt.colorbar()
plt.title('contourf with levels')
plt.show()
Keywords: python, matplotlib, pylab, example, codex (see Search examples)