Learn what to expect in the new updates

(Source code, png, hires.png, pdf)
#!/usr/bin/env python
"""
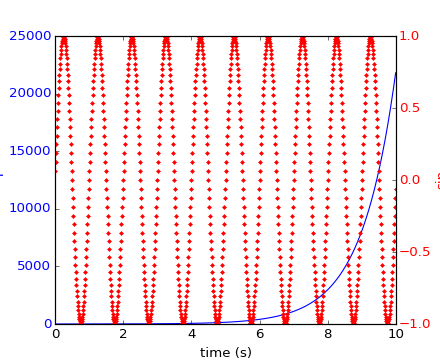
Demonstrate how to do two plots on the same axes with different left
right scales.
The trick is to use *2 different axes*. Turn the axes rectangular
frame off on the 2nd axes to keep it from obscuring the first.
Manually set the tick locs and labels as desired. You can use
separate matplotlib.ticker formatters and locators as desired since
the two axes are independent.
This is achieved in the following example by calling the Axes.twinx()
method, which performs this work. See the source of twinx() in
axes.py for an example of how to do it for different x scales. (Hint:
use the xaxis instance and call tick_bottom and tick_top in place of
tick_left and tick_right.)
The twinx and twiny methods are also exposed as pyplot functions.
"""
import numpy as np
import matplotlib.pyplot as plt
fig, ax1 = plt.subplots()
t = np.arange(0.01, 10.0, 0.01)
s1 = np.exp(t)
ax1.plot(t, s1, 'b-')
ax1.set_xlabel('time (s)')
# Make the y-axis label and tick labels match the line color.
ax1.set_ylabel('exp', color='b')
for tl in ax1.get_yticklabels():
tl.set_color('b')
ax2 = ax1.twinx()
s2 = np.sin(2*np.pi*t)
ax2.plot(t, s2, 'r.')
ax2.set_ylabel('sin', color='r')
for tl in ax2.get_yticklabels():
tl.set_color('r')
plt.show()
Keywords: python, matplotlib, pylab, example, codex (see Search examples)