Learn what to expect in the new updates

(Source code, png, hires.png, pdf)
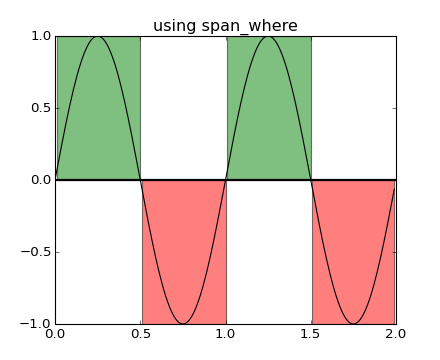
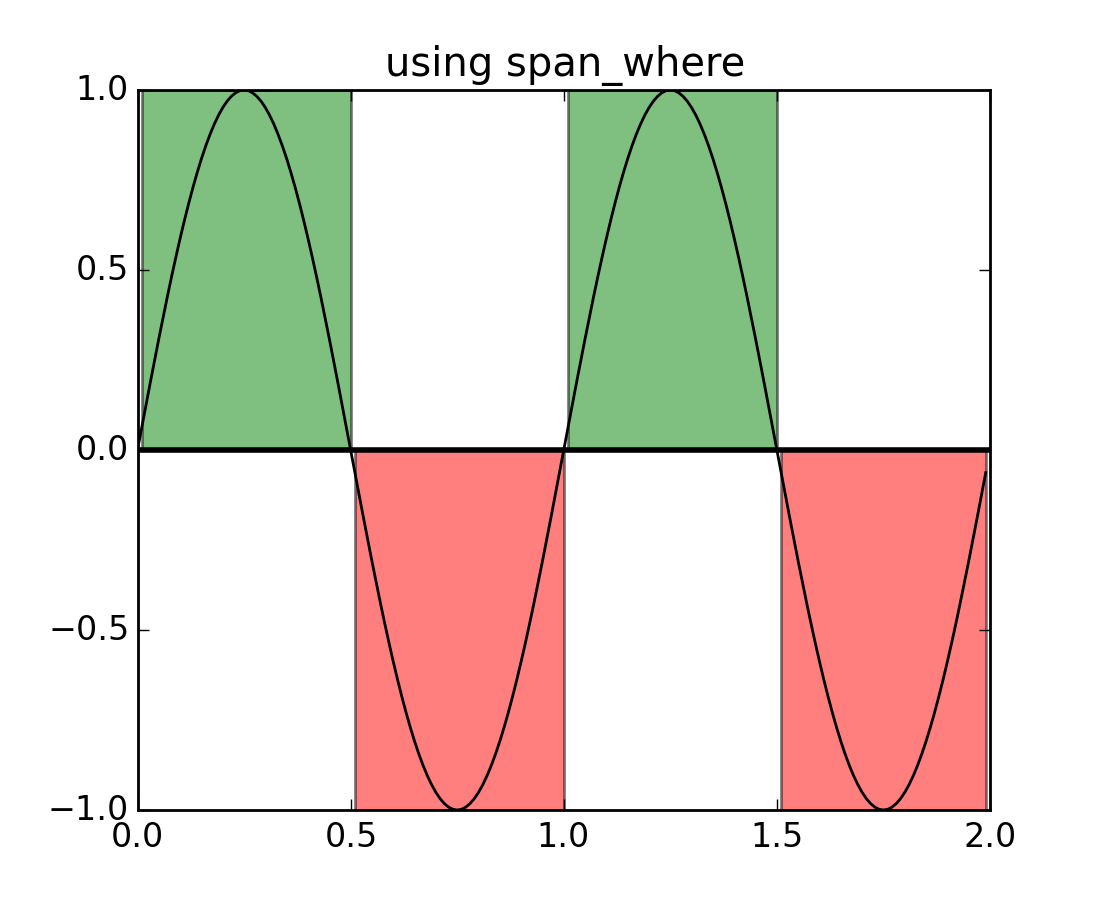
"""
Illustrate some helper functions for shading regions where a logical
mask is True

See :meth:`matplotlib.collections.BrokenBarHCollection.span_where`
"""
import numpy as np
import matplotlib.pyplot as plt
import matplotlib.collections as collections


t = np.arange(0.0, 2, 0.01)
s1 = np.sin(2*np.pi*t)
s2 = 1.2*np.sin(4*np.pi*t)


fig, ax = plt.subplots()
ax.set_title('using span_where')
ax.plot(t, s1, color='black')
ax.axhline(0, color='black', lw=2)

collection = collections.BrokenBarHCollection.span_where(
       t, ymin=0, ymax=1, where=s1>0, facecolor='green', alpha=0.5)
ax.add_collection(collection)

collection = collections.BrokenBarHCollection.span_where(
       t, ymin=-1, ymax=0, where=s1<0, facecolor='red', alpha=0.5)
ax.add_collection(collection)


plt.show()
Keywords: python, matplotlib, pylab, example, codex (see Search examples)