
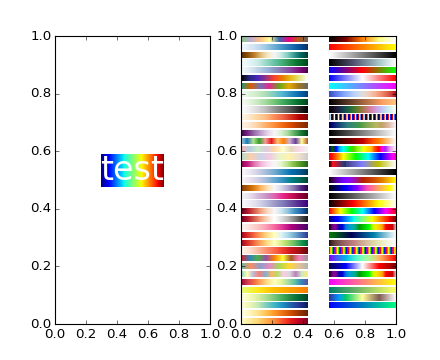
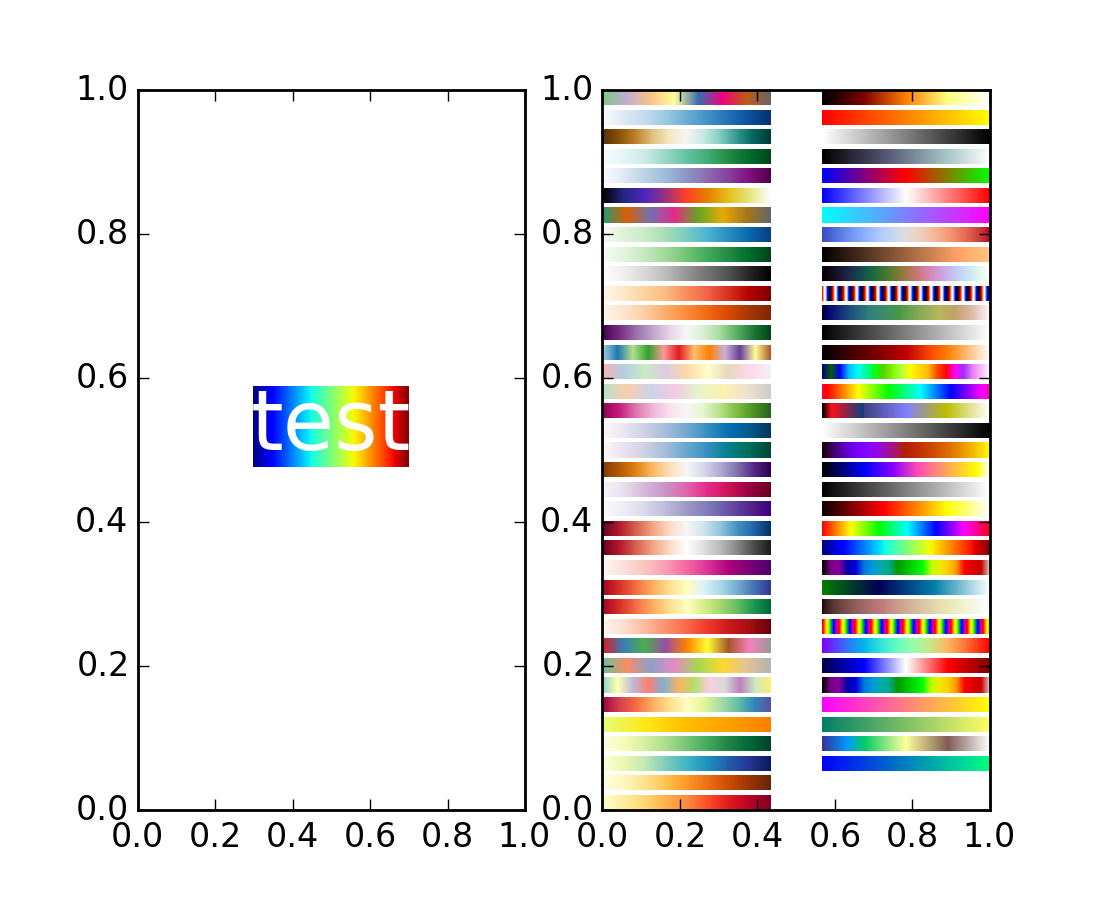
(Source code, png, hires.png, pdf)

import matplotlib.pyplot as plt
import numpy as np
from matplotlib.image import BboxImage
from matplotlib.transforms import Bbox, TransformedBbox

if __name__ == "__main__":

    fig = plt.figure(1)
    ax = plt.subplot(121)

    txt = ax.text(0.5, 0.5, "test", size=30, ha="center", color="w")
    kwargs = dict()

    bbox_image = BboxImage(txt.get_window_extent,
                           norm = None,
                           origin=None,
                           clip_on=False,
                           **kwargs
                           )
    a = np.arange(256).reshape(1,256)/256.
    bbox_image.set_data(a)
    ax.add_artist(bbox_image)


    ax = plt.subplot(122)
    a = np.linspace(0, 1, 256).reshape(1,-1)
    a = np.vstack((a,a))

    maps = sorted(m for m in plt.cm.datad if not m.endswith("_r"))
    #nmaps = len(maps) + 1

    #fig.subplots_adjust(top=0.99, bottom=0.01, left=0.2, right=0.99)

    ncol = 2
    nrow = len(maps)//ncol + 1

    xpad_fraction = 0.3
    dx = 1./(ncol + xpad_fraction*(ncol-1))

    ypad_fraction = 0.3
    dy = 1./(nrow + ypad_fraction*(nrow-1))

    for i,m in enumerate(maps):
        ix, iy = divmod(i, nrow)
        #plt.figimage(a, 10, i*10, cmap=plt.get_cmap(m), origin='lower')
        bbox0 = Bbox.from_bounds(ix*dx*(1+xpad_fraction),
                                 1.-iy*dy*(1+ypad_fraction)-dy,
                                 dx, dy)
        bbox = TransformedBbox(bbox0, ax.transAxes)

        bbox_image = BboxImage(bbox,
                               cmap = plt.get_cmap(m),
                               norm = None,
                               origin=None,
                               **kwargs
                               )

        bbox_image.set_data(a)
        ax.add_artist(bbox_image)

    plt.draw()
    plt.show()
Keywords: python, matplotlib, pylab, example, codex (see Search examples)