
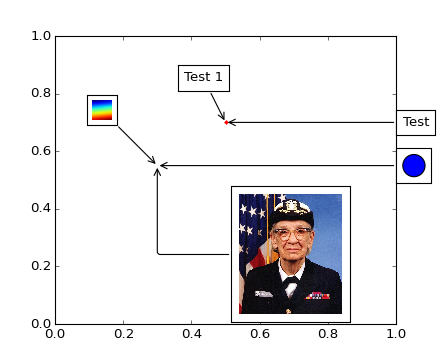
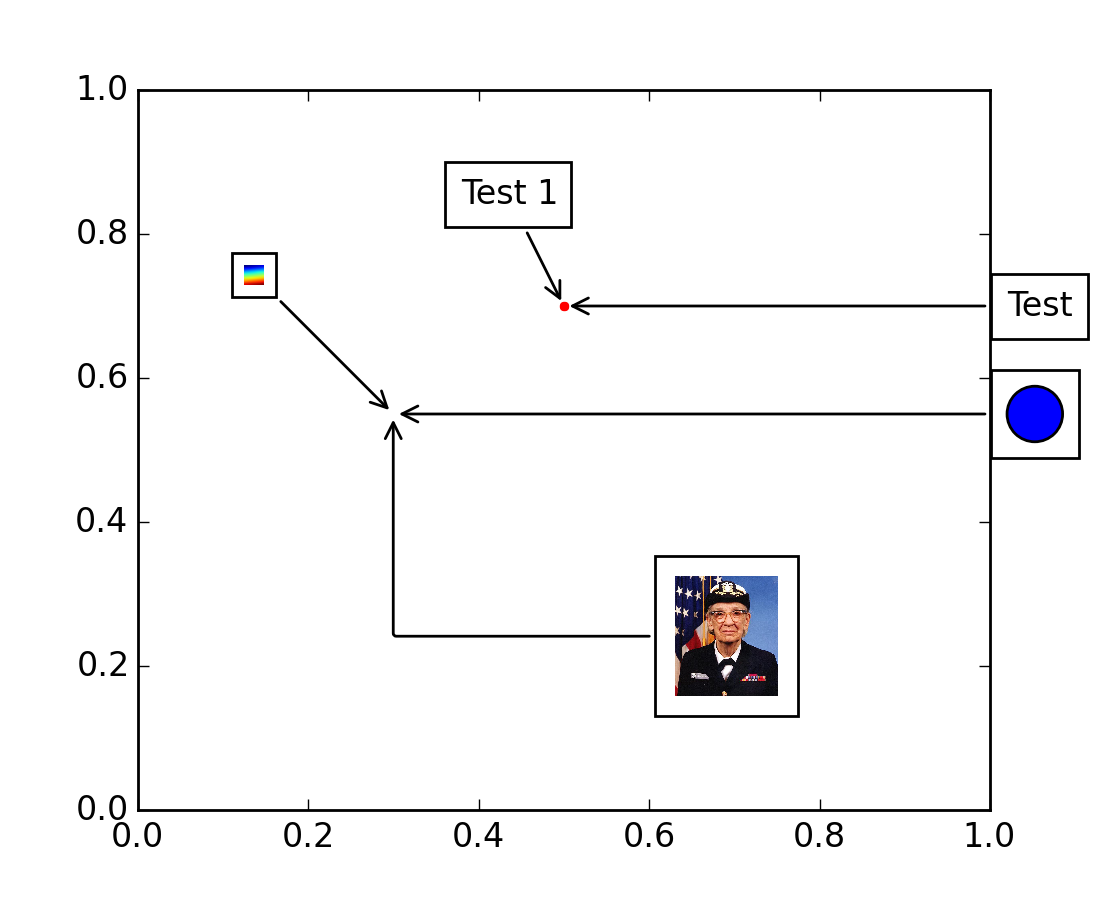
(Source code, png, hires.png, pdf)
import matplotlib.pyplot as plt
from matplotlib.offsetbox import TextArea, DrawingArea, OffsetImage, \
     AnnotationBbox
from matplotlib.cbook import get_sample_data

import numpy as np

if 1:
    fig, ax = plt.subplots()

    offsetbox = TextArea("Test 1", minimumdescent=False)

    xy = (0.5, 0.7)

    ax.plot(xy[0], xy[1], ".r")

    ab = AnnotationBbox(offsetbox, xy,
                        xybox=(-20, 40),
                        xycoords='data',
                        boxcoords="offset points",
                        arrowprops=dict(arrowstyle="->"))
    ax.add_artist(ab)

    offsetbox = TextArea("Test", minimumdescent=False)

    ab = AnnotationBbox(offsetbox, xy,
                        xybox=(1.02, xy[1]),
                        xycoords='data',
                        boxcoords=("axes fraction", "data"),
                        box_alignment=(0.,0.5),
                        arrowprops=dict(arrowstyle="->"))
    ax.add_artist(ab)


    from matplotlib.patches import Circle
    da = DrawingArea(20, 20, 0, 0)
    p = Circle((10, 10), 10)
    da.add_artist(p)

    xy = [0.3, 0.55]
    ab = AnnotationBbox(da, xy,
                        xybox=(1.02, xy[1]),
                        xycoords='data',
                        boxcoords=("axes fraction", "data"),
                        box_alignment=(0.,0.5),
                        arrowprops=dict(arrowstyle="->"))
                        #arrowprops=None)

    ax.add_artist(ab)


    arr = np.arange(100).reshape((10,10))
    im = OffsetImage(arr, zoom=2)

    ab = AnnotationBbox(im, xy,
                        xybox=(-50., 50.),
                        xycoords='data',
                        boxcoords="offset points",
                        pad=0.3,
                        arrowprops=dict(arrowstyle="->"))
                        #arrowprops=None)

    ax.add_artist(ab)


    # another image


    from matplotlib._png import read_png
    fn = get_sample_data("grace_hopper.png", asfileobj=False)
    arr_lena = read_png(fn)

    imagebox = OffsetImage(arr_lena, zoom=0.2)

    ab = AnnotationBbox(imagebox, xy,
                        xybox=(120., -80.),
                        xycoords='data',
                        boxcoords="offset points",
                        pad=0.5,
                        arrowprops=dict(arrowstyle="->",
                                        connectionstyle="angle,angleA=0,angleB=90,rad=3")
                        )


    ax.add_artist(ab)

    ax.set_xlim(0, 1)
    ax.set_ylim(0, 1)


    plt.draw()
    plt.show()
Keywords: python, matplotlib, pylab, example, codex (see Search examples)