
Do not proceed unless you already have read legend() and matplotlib.legend.Legend!
The legend command has a following call signature:
legend(*args, **kwargs)
If len(args) is 2, the first argument should be a list of artist to be labeled, and the second argument should a list of string labels. If len(args) is 0, it automatically generate the legend from label properties of the child artists by calling get_legend_handles_labels() method. For example, ax.legend() is equivalent to:
handles, labels = ax.get_legend_handles_labels()
ax.legend(handles, labels)
The get_legend_handles_labels() method returns a tuple of two lists, i.e., list of artists and list of labels (python string). However, it does not return all of its child artists. It returns artists that are currently supported by matplotlib.
For matplotlib v1.0 and earlier, the supported artists are as follows.
And, get_legend_handles_labels() returns all artists in ax.lines, ax.patches and artists in ax.collection which are instance of LineCollection or RegularPolyCollection. The label attributes (returned by get_label() method) of collected artists are used as text labels. If label attribute is empty string or starts with “_”, those artists will be ignored.
Therefore, plots drawn by some pyplot commands are not supported by legend. For example, fill_between() creates PolyCollection that is not supported. Also support is limited for some commands that create multiple artists. For example, errorbar() creates multiples Line2D instances.
Unfortunately, there is no easy workaround when you need legend for an artist not supported by matplotlib (You may use one of the supported artist as a proxy. See below)
In newer version of matplotlib (v1.1 and later), the matplotlib internals are revised to support
- complex plots that creates multiple artists (e.g., bar, errorbar, etc)
- custom legend handles
See below for details of new functionality.
When you want to customize the list of artists to be displayed in the legend, or their order of appearance. There are a two options. First, you can keep lists of artists and labels, and explicitly use these for the first two argument of the legend call.:
p1, = plot([1,2,3])
p2, = plot([3,2,1])
p3, = plot([2,3,1])
legend([p2, p1], ["line 2", "line 1"])
Or you may use get_legend_handles_labels() to retrieve list of artist and labels and manipulate them before feeding them to legend call.:
ax = subplot(1,1,1)
p1, = ax.plot([1,2,3], label="line 1")
p2, = ax.plot([3,2,1], label="line 2")
p3, = ax.plot([2,3,1], label="line 3")

handles, labels = ax.get_legend_handles_labels()

# reverse the order
ax.legend(handles[::-1], labels[::-1])

# or sort them by labels
import operator
hl = sorted(zip(handles, labels),
            key=operator.itemgetter(1))
handles2, labels2 = zip(*hl)

ax.legend(handles2, labels2)
When you want to display legend for an artist not supported by matplotlib, you may use another artist as a proxy. For example, you may create a proxy artist without adding it to the axes (so the proxy artist will not be drawn in the main axes) and feed it to the legend function.:
p = Rectangle((0, 0), 1, 1, fc="r")
legend([p], ["Red Rectangle"])
By specifying the keyword argument ncol, you can have a multi-column legend. Also, mode=”expand” horizontally expand the legend to fill the axes area. See legend_demo3.py for example.
The location of the legend can be specified by the keyword argument loc, either by string or a integer number.
| String | Number |
|---|---|
| upper right | 1 |
| upper left | 2 |
| lower left | 3 |
| lower right | 4 |
| right | 5 |
| center left | 6 |
| center right | 7 |
| lower center | 8 |
| upper center | 9 |
| center | 10 |
By default, the legend will anchor to the bbox of the axes (for legend) or the bbox of the figure (figlegend). You can specify your own bbox using bbox_to_anchor argument. bbox_to_anchor can be an instance of BboxBase, a tuple of 4 floats (x, y, width, height of the bbox), or a tuple of 2 floats (x, y with width=height=0). Unless bbox_transform argument is given, the coordinates (even for the bbox instance) are considered as normalized axes coordinates.
For example, if you want your axes legend located at the figure corner (instead of the axes corner):
l = legend(bbox_to_anchor=(0, 0, 1, 1), bbox_transform=gcf().transFigure)
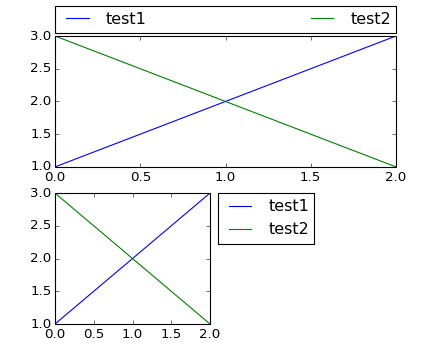
Also, you can place above or outer right-hand side of the axes,
from matplotlib.pyplot import *

subplot(211)
plot([1,2,3], label="test1")
plot([3,2,1], label="test2")
legend(bbox_to_anchor=(0., 1.02, 1., .102), loc=3,
       ncol=2, mode="expand", borderaxespad=0.)

subplot(223)
plot([1,2,3], label="test1")
plot([3,2,1], label="test2")
legend(bbox_to_anchor=(1.05, 1), loc=2, borderaxespad=0.)


show()
(Source code, png, hires.png, pdf)
Sometime, you want to split the legend into multiple ones.:
p1, = plot([1,2,3])
p2, = plot([3,2,1])
legend([p1], ["Test1"], loc=1)
legend([p2], ["Test2"], loc=4)
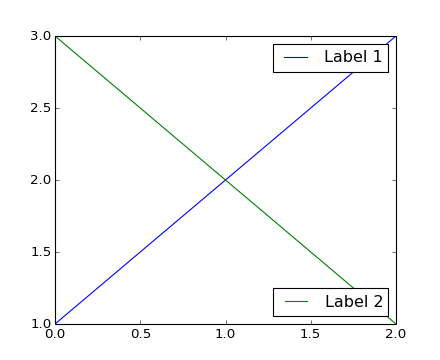
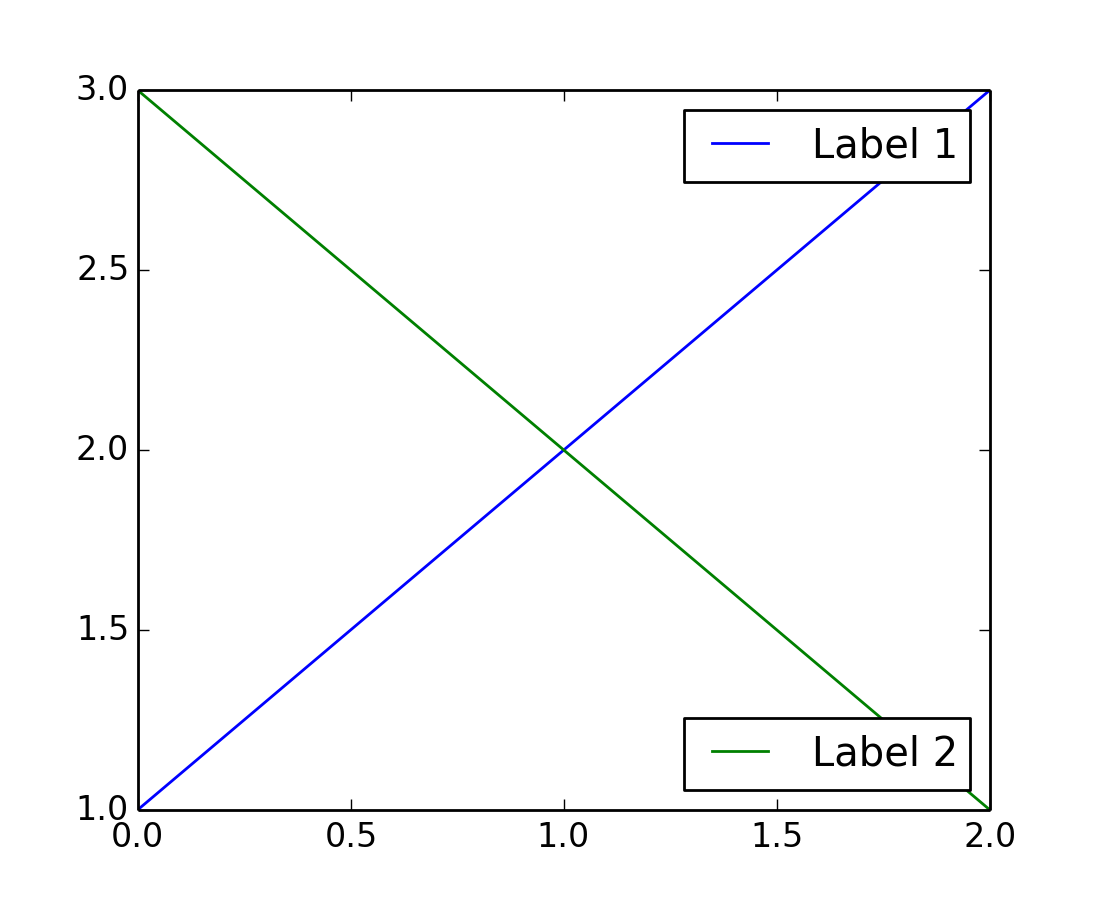
However, the above code only shows the second legend. When the legend command is called, a new legend instance is created and old ones are removed from the axes. Thus, you need to manually add the removed legend.
from matplotlib.pyplot import *

p1, = plot([1,2,3], label="test1")
p2, = plot([3,2,1], label="test2")

l1 = legend([p1], ["Label 1"], loc=1)
l2 = legend([p2], ["Label 2"], loc=4) # this removes l1 from the axes.
gca().add_artist(l1) # add l1 as a separate artist to the axes

show()
(Source code, png, hires.png, pdf)
In matplotlib v1.1 and later, the legend is improved to support more plot commands and ease the customization.
The Artist Container is simple class (derived from tuple) that contains multiple artists. This is introduced primarily to support legends for complex plot commands that create multiple artists.
Axes instances now have a “containers” attribute (which is a list, and this is only intended to be used for generating a legend). The items in this attribute are also returned by get_legend_handles_labels().
For example, “bar” command creates a series of Rectangle patches. Previously, it returned a list of these patches. With the current change, it creates a container object of these rectangle patches (and these patches are added to Axes.patches attribute as before) and return it instead. As the container class is derived from a tuple, it should be backward-compatible. Furthermore, the container object is added to the Axes.containers attributes so that legend command can properly create a legend for the bar. Thus, you may do
b1 = bar([0, 1, 2], [0.2, 0.3, 0.1], width=0.4,
         label="Bar 1", align="center")
legend()
or
b1 = bar([0, 1, 2], [0.2, 0.3, 0.1], width=0.4, align="center")
legend([b1], ["Bar 1"])
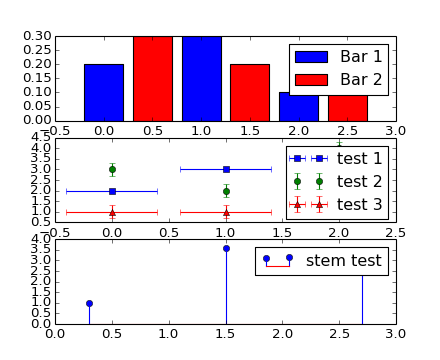
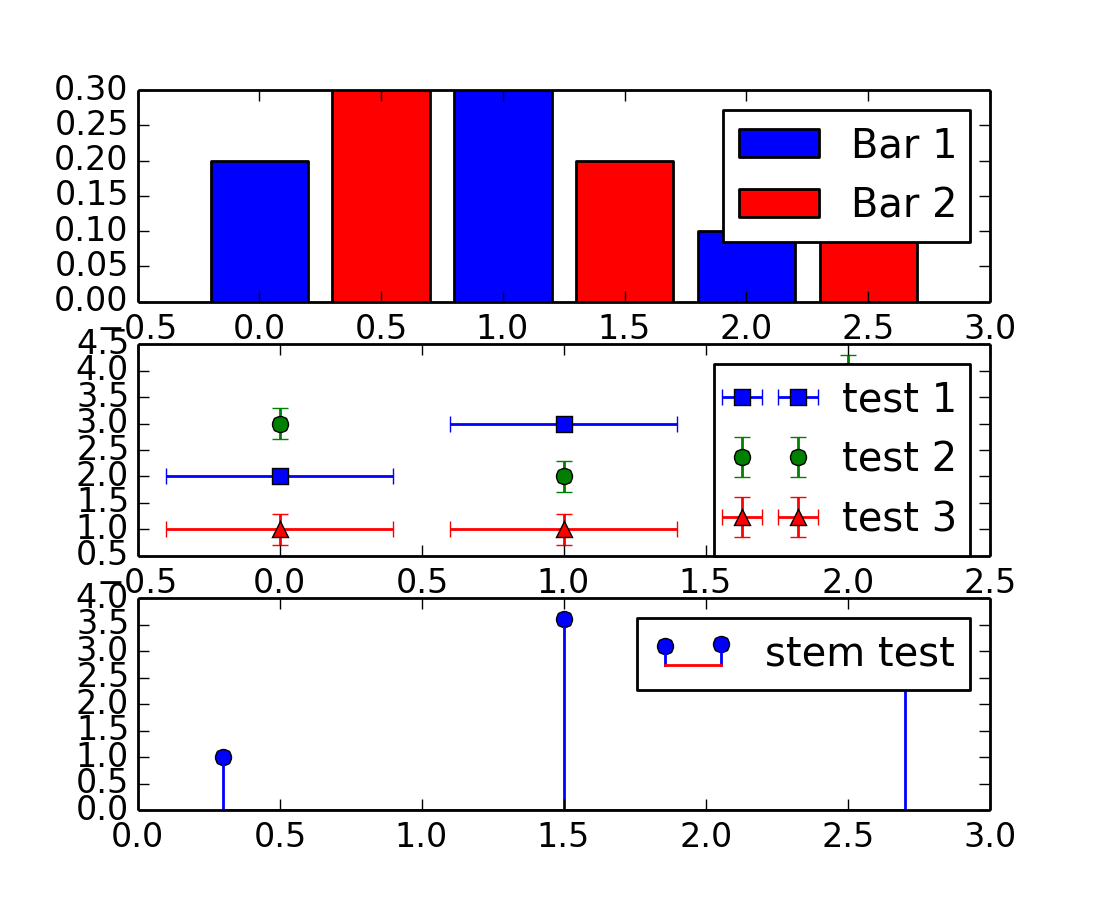
At this time of writing, however, only “bar”, “errorbar”, and “stem” are supported (hopefully the list will increase). Here is an example.
(Source code, png, hires.png, pdf)
One of the changes is that drawing of legend handles has been delegated to legend handlers. For example, Line2D instances are handled by HandlerLine2D. The mapping between the artists and their corresponding handlers are defined in a handler_map of the legend. The handler_map is a dictionary of key-handler pair, where key can be an artist instance or its class. And the handler is a Handler instance.
Let’s consider the following sample code,
legend([p_1, p_2,..., p_i, ...], ["Test 1", "Test 2", ..., "Test i",...])
For each p_i, matplotlib
- check if p_i is in the handler_map
- if not, iterate over type(p_i).mro() until a matching key is found in the handler_map
Unless specified, the default handler_map is used. Below is a partial list of key-handler pairs included in the default handler map.
- Line2D : legend_handler.HandlerLine2D()
- Patch : legend_handler.HandlerPatch()
- LineCollection : legend_handler.HandlerLineCollection()
- ...
The legend() command takes an optional argument of “handler_map”. When provided, the default handler map will be updated (using dict.update method) with the provided one.
p1, = plot(x, "ro", label="test1")
p2, = plot(y, "b+", ms=10, label="test2")

my_handler = HandlerLine2D(numpoints=1)

legend(handler_map={Line2D:my_handler})
The above example will use my_handler for any Line2D instances (p1 and p2).
legend(handler_map={p1:HandlerLine2D(numpoints=1)})
In the above example, only p1 will be handled by my_handler, while others will be handled by default handlers.
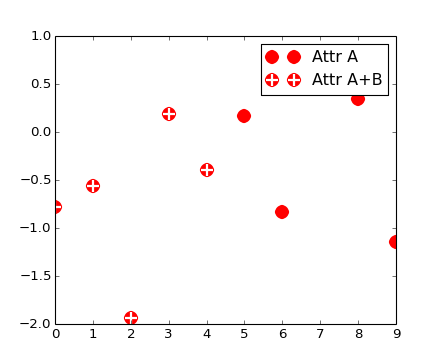
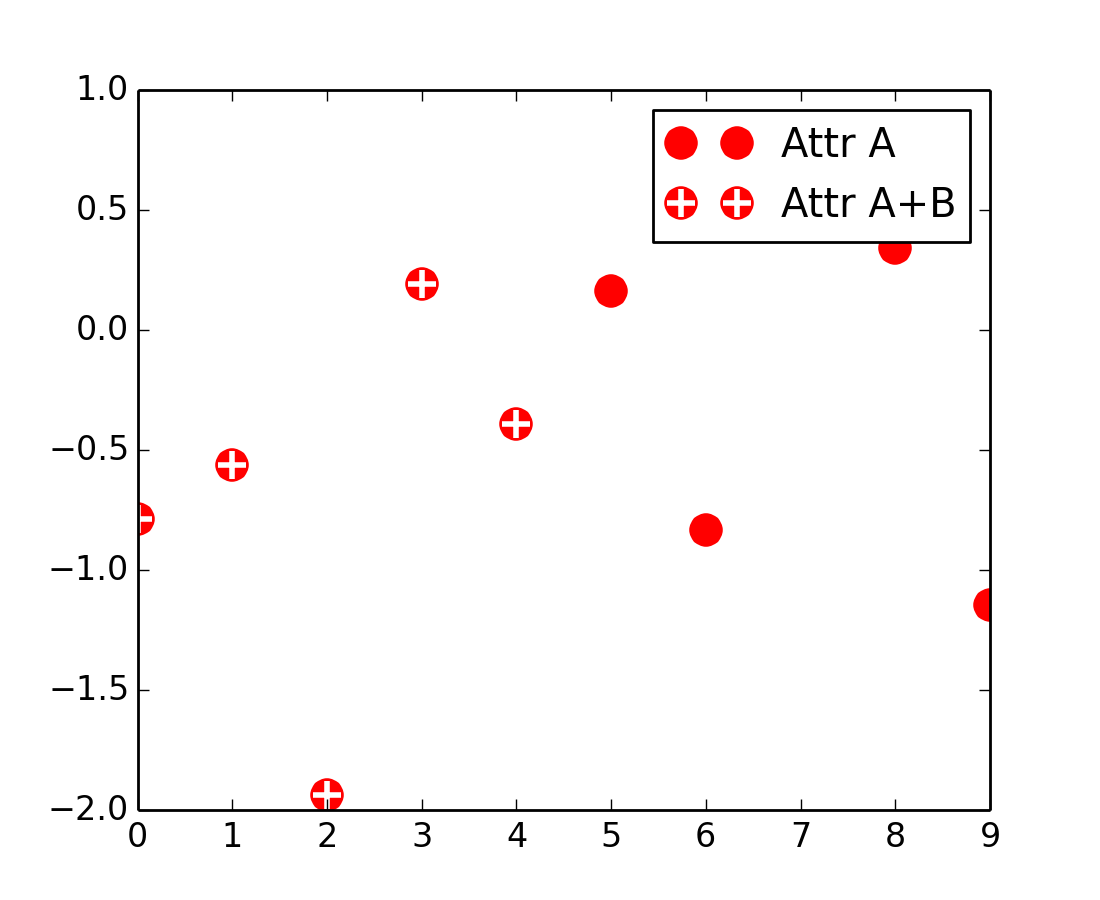
The current default handler_map has handlers for errorbar and bar plots. Also, it includes an entry for tuple which is mapped to HandlerTuple. It simply plots over all the handles for items in the given tuple. For example,
z = np.random.randn(10)

p1a, = plt.plot(z, "ro", ms=10, mfc="r", mew=2, mec="r") # red filled circle
p1b, = plt.plot(z[:5], "w+", ms=10, mec="w", mew=2) # white cross

plt.legend([p1a, (p1a, p1b)], ["Attr A", "Attr A+B"])
(Source code, png, hires.png, pdf)

Handler can be any callable object with following signature.
def __call__(self, legend, orig_handle,
             fontsize,
             handlebox):
Where legend is the legend itself, orig_handle is the original plot (p_i in the above example), fontsize is the fontsize in pixels, and handlebox is a OffsetBox instance. Within the call, you create relevant artists (using relevant properties from the legend and/or orig_handle) and add them into the handlebox. The artists needs to be scaled according to the fontsize (note that the size is in pixel, i.e., this is dpi-scaled value). See legend_handler for more details.