Note
Go to the end to download the full example code.
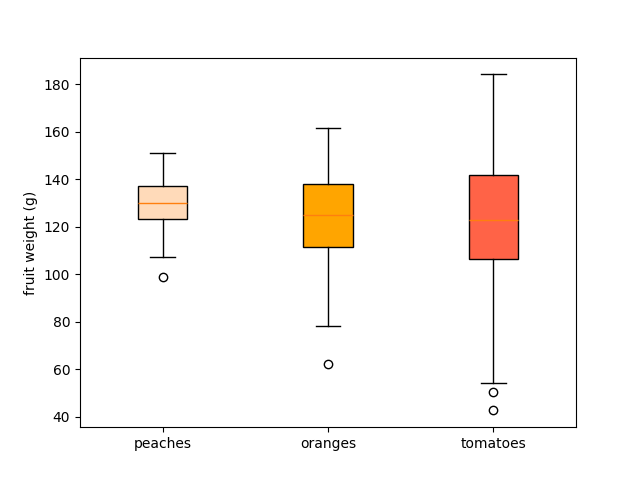
Box plots with custom fill colors#
To color each box of a box plot individually:
use the keyword argument
patch_artist=Trueto create filled boxes.loop through the created boxes and adapt their color.
import matplotlib.pyplot as plt
import numpy as np

np.random.seed(19680801)
fruit_weights = [
    np.random.normal(130, 10, size=100),
    np.random.normal(125, 20, size=100),
    np.random.normal(120, 30, size=100),
]
labels = ['peaches', 'oranges', 'tomatoes']
colors = ['peachpuff', 'orange', 'tomato']

fig, ax = plt.subplots()
ax.set_ylabel('fruit weight (g)')

bplot = ax.boxplot(fruit_weights,
                   patch_artist=True,  # fill with color
                   tick_labels=labels)  # will be used to label x-ticks

# fill with colors
for patch, color in zip(bplot['boxes'], colors):
    patch.set_facecolor(color)

plt.show()
References
The use of the following functions, methods, classes and modules is shown in this example: