MEP28: Remove Complexity from Axes.boxplot#
Status#
Discussion
Branches and Pull requests#
The following lists any open PRs or branches related to this MEP:
Deprecate redundant statistical kwargs in
Axes.boxplot: phobson/matplotlibDeprecate redundant style options in
Axes.boxplot: phobson/matplotlibDeprecate passings 2D NumPy arrays as input: None
Add pre- & post-processing options to
cbook.boxplot_stats: phobson/matplotlibExposing
cbook.boxplot_statsthroughAxes.boxplotkwargs: NoneRemove redundant statistical kwargs in
Axes.boxplot: NoneRemove redundant style options in
Axes.boxplot: NoneRemaining items that arise through discussion: None
Abstract#
Over the past few releases, the Axes.boxplot method has grown in
complexity to support fully customizable artist styling and statistical
computation. This lead to Axes.boxplot being split off into multiple
parts. The statistics needed to draw a boxplot are computed in
cbook.boxplot_stats, while the actual artists are drawn by Axes.bxp.
The original method, Axes.boxplot remains as the most public API that
handles passing the user-supplied data to cbook.boxplot_stats, feeding
the results to Axes.bxp, and pre-processing style information for
each facet of the boxplot plots.
This MEP will outline a path forward to rollback the added complexity and simplify the API while maintaining reasonable backwards compatibility.
Detailed description#
Currently, the Axes.boxplot method accepts parameters that allow the
users to specify medians and confidence intervals for each box that
will be drawn in the plot. These were provided so that advanced users
could provide statistics computed in a different fashion that the simple
method provided by matplotlib. However, handling this input requires
complex logic to make sure that the forms of the data structure match what
needs to be drawn. At the moment, that logic contains 9 separate if/else
statements nested up to 5 levels deep with a for loop, and may raise up to 2 errors.
These parameters were added prior to the creation of the Axes.bxp method,
which draws boxplots from a list of dictionaries containing the relevant
statistics. Matplotlib also provides a function that computes these
statistics via cbook.boxplot_stats. Note that advanced users can now
either a) write their own function to compute the stats required by
Axes.bxp, or b) modify the output returned by cbook.boxplots_stats
to fully customize the position of the artists of the plots. With this
flexibility, the parameters to manually specify only the medians and their
confidences intervals remain for backwards compatibility.
Around the same time that the two roles of Axes.boxplot were split into
cbook.boxplot_stats for computation and Axes.bxp for drawing, both
Axes.boxplot and Axes.bxp were written to accept parameters that
individually toggle the drawing of all components of the boxplots, and
parameters that individually configure the style of those artists. However,
to maintain backwards compatibility, the sym parameter (previously used
to specify the symbol of the fliers) was retained. This parameter itself
requires fairly complex logic to reconcile the sym parameters with the
newer flierprops parameter at the default style specified by matplotlibrc.
This MEP seeks to dramatically simplify the creation of boxplots for novice and advanced users alike. Importantly, the changes proposed here will also be available to downstream packages like seaborn, as seaborn smartly allows users to pass arbitrary dictionaries of parameters through the seaborn API to the underlying matplotlib functions.
This will be achieved in the following way:
cbook.boxplot_statswill be modified to allow pre- and post- computation transformation functions to be passed in (e.g.,np.logandnp.expfor lognormally distributed data)Axes.boxplotwill be modified to also accept and naïvely pass them tocbook.boxplots_stats(Alt: pass the stat function and a dict of its optional parameters).Outdated parameters from
Axes.boxplotwill be deprecated and later removed.
Importance#
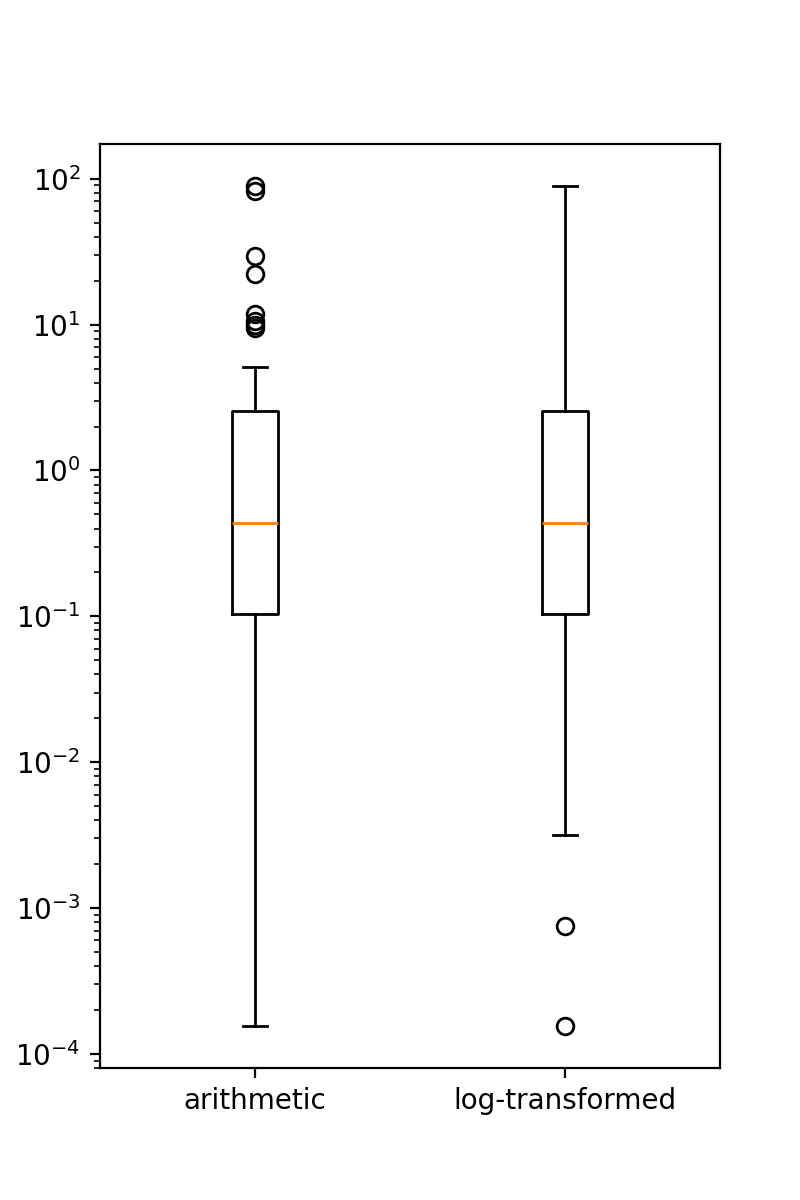
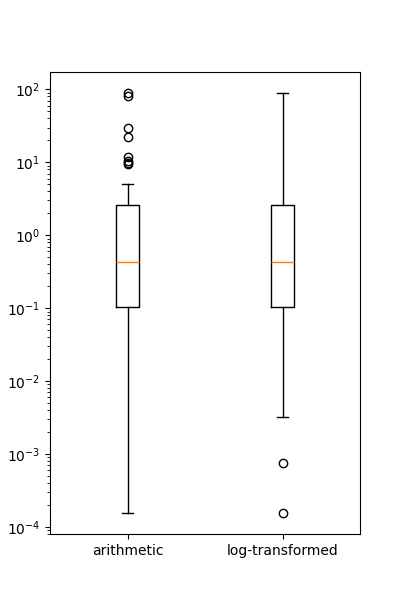
Since the limits of the whiskers are computed arithmetically, there is an implicit assumption of normality in box and whisker plots. This primarily affects which data points are classified as outliers.
Allowing transformations to the data and the results used to draw boxplots will allow users to opt-out of that assumption if the data are known to not fit a normal distribution.
Below is an example of how Axes.boxplot classifies outliers of lognormal
data differently depending one these types of transforms.
import numpy as np
import matplotlib.pyplot as plt
from matplotlib import cbook
np.random.seed(0)

fig, ax = plt.subplots(figsize=(4, 6))
ax.set_yscale('log')
data = np.random.lognormal(-1.75, 2.75, size=37)

stats = cbook.boxplot_stats(data, labels=['arithmetic'])
logstats = cbook.boxplot_stats(np.log(data), labels=['log-transformed'])

for lsdict in logstats:
    for key, value in lsdict.items():
        if key != 'label':
            lsdict[key] = np.exp(value)

stats.extend(logstats)
ax.bxp(stats)
fig.show()
(Source code, 2x.png, png)

Implementation#
Passing transform functions to cbook.boxplots_stats#
This MEP proposes that two parameters (e.g., transform_in and
transform_out be added to the cookbook function that computes the
statistics for the boxplot function. These will be optional keyword-only
arguments and can easily be set to lambda x: x as a no-op when omitted
by the user. The transform_in function will be applied to the data
as the boxplot_stats function loops through each subset of the data
passed to it. After the list of statistics dictionaries are computed the
transform_out function is applied to each value in the dictionaries.
These transformations can then be added to the call signature of
Axes.boxplot with little impact to that method's complexity. This is
because they can be directly passed to cbook.boxplot_stats.
Alternatively, Axes.boxplot could be modified to accept an optional
statistical function kwarg and a dictionary of parameters to be directly
passed to it.
At this point in the implementation users and external libraries like
seaborn would have complete control via the Axes.boxplot method. More
importantly, at the very least, seaborn would require no changes to its
API to allow users to take advantage of these new options.
Simplifications to the Axes.boxplot API and other functions#
Simplifying the boxplot method consists primarily of deprecating and then
removing the redundant parameters. Optionally, a next step would include
rectifying minor terminological inconsistencies between Axes.boxplot
and Axes.bxp.
The parameters to be deprecated and removed include:
usermedians- processed by 10 SLOC, 3ifblocks, aforloopconf_intervals- handled by 15 SLOC, 6ifblocks, aforloopsym- processed by 12 SLOC, 4ifblocks
Removing the sym option allows all code in handling the remaining
styling parameters to be moved to Axes.bxp. This doesn't remove
any complexity, but does reinforce the single responsibility principle
among Axes.bxp, cbook.boxplot_stats, and Axes.boxplot.
Additionally, the notch parameter could be renamed shownotches
to be consistent with Axes.bxp. This kind of cleanup could be taken
a step further and the whis, bootstrap, autorange could
be rolled into the kwargs passed to the new statfxn parameter.
Backward compatibility#
Implementation of this MEP would eventually result in the backwards
incompatible deprecation and then removal of the keyword parameters
usermedians, conf_intervals, and sym. Cursory searches on
GitHub indicated that usermedians, conf_intervals are used by
few users, who all seem to have a very strong knowledge of matplotlib.
A robust deprecation cycle should provide sufficient time for these
users to migrate to a new API.
Deprecation of sym however, may have a much broader reach into
the matplotlib userbase.
Schedule#
An accelerated timeline could look like the following:
v2.0.1 add transforms to
cbook.boxplots_stats, expose inAxes.boxplotv2.1.0 Initial Deprecations , and using 2D NumPy arrays as input
Using 2D NumPy arrays as input. The semantics around 2D arrays are generally confusing.
usermedians,conf_intervals,symparameters
v2.2.0
remove
usermedians,conf_intervals,symparametersdeprecate
notchin favor ofshownotchesto be consistent with other parameters andAxes.bxp
v2.3.0
remove
notchparametermove all style and artist toggling logic to
Axes.bxpsuchAxes.boxplotis little more than a broker betweenAxes.bxpandcbook.boxplots_stats
Anticipated Impacts to Users#
As described above deprecating usermedians and conf_intervals
will likely impact few users. Those who will be impacted are almost
certainly advanced users who will be able to adapt to the change.
Deprecating the sym option may import more users and effort should
be taken to collect community feedback on this.
Anticipated Impacts to Downstream Libraries#
The source code (GitHub master as of 2016-10-17) was inspected for
seaborn and python-ggplot to see if these changes would impact their
use. None of the parameters nominated for removal in this MEP are used by
seaborn. The seaborn APIs that use matplotlib's boxplot function allow
user's to pass arbitrary **kwargs through to matplotlib's API. Thus
seaborn users with modern matplotlib installations will be able to take
full advantage of any new features added as a result of this MEP.
Python-ggplot has implemented its own function to draw boxplots. Therefore, no impact can come to it as a result of implementing this MEP.
Alternatives#
Variations on the theme#
This MEP can be divided into a few loosely coupled components:
Allowing pre- and post-computation transformation function in
cbook.boxplot_statsExposing that transformation in the
Axes.boxplotAPIRemoving redundant statistical options in
Axes.boxplotShifting all styling parameter processing from
Axes.boxplottoAxes.bxp.
With this approach, #2 depends and #1, and #4 depends on #3.
There are two possible approaches to #2. The first and most direct would
be to mirror the new transform_in and transform_out parameters of
cbook.boxplot_stats in Axes.boxplot and pass them directly.
The second approach would be to add statfxn and statfxn_args
parameters to Axes.boxplot. Under this implementation, the default
value of statfxn would be cbook.boxplot_stats, but users could
pass their own function. Then transform_in and transform_out would
then be passed as elements of the statfxn_args parameter.
def boxplot_stats(data, ..., transform_in=None, transform_out=None):
    if transform_in is None:
        transform_in = lambda x: x

    if transform_out is None:
        transform_out = lambda x: x

    output = []
    for _d in data:
        d = transform_in(_d)
        stat_dict = do_stats(d)
        for key, value in stat_dict.item():
            if key != 'label':
                stat_dict[key] = transform_out(value)
        output.append(d)
    return output


 class Axes(...):
     def boxplot_option1(data, ..., transform_in=None, transform_out=None):
         stats = cbook.boxplot_stats(data, ...,
                                     transform_in=transform_in,
                                     transform_out=transform_out)
         return self.bxp(stats, ...)

     def boxplot_option2(data, ..., statfxn=None, **statopts):
         if statfxn is None:
             statfxn = boxplot_stats
         stats = statfxn(data, **statopts)
         return self.bxp(stats, ...)
Both cases would allow users to do the following:
fig, ax1 = plt.subplots()
artists1 = ax1.boxplot_optionX(data, transform_in=np.log,
                               transform_out=np.exp)
But Option Two lets a user write a completely custom stat function
(e.g., my_box_stats) with fancy BCA confidence intervals and the
whiskers set differently depending on some attribute of the data.
This is available under the current API:
fig, ax1 = plt.subplots()
my_stats = my_box_stats(data, bootstrap_method='BCA',
                        whisker_method='dynamic')
ax1.bxp(my_stats)
And would be more concise with Option Two
fig, ax = plt.subplots()
statopts = dict(transform_in=np.log, transform_out=np.exp)
ax.boxplot(data, ..., **statopts)
Users could also pass their own function to compute the stats:
fig, ax1 = plt.subplots()
ax1.boxplot(data, statfxn=my_box_stats, bootstrap_method='BCA',
            whisker_method='dynamic')
From the examples above, Option Two seems to have only marginal benefit, but in the context of downstream libraries like seaborn, its advantage is more apparent as the following would be possible without any patches to seaborn:
import seaborn
tips = seaborn.load_data('tips')
g = seaborn.factorplot(x="day", y="total_bill", hue="sex", data=tips,
                       kind='box', palette="PRGn", shownotches=True,
                       statfxn=my_box_stats, bootstrap_method='BCA',
                       whisker_method='dynamic')
This type of flexibility was the intention behind splitting the overall
boxplot API in the current three functions. In practice however, downstream
libraries like seaborn support versions of matplotlib dating back well
before the split. Thus, adding just a bit more flexibility to the
Axes.boxplot could expose all the functionality to users of the
downstream libraries with modern matplotlib installation without intervention
from the downstream library maintainers.
Doing less#
Another obvious alternative would be to omit the added pre- and post-
computation transform functionality in cbook.boxplot_stats and
Axes.boxplot, and simply remove the redundant statistical and style
parameters as described above.
Doing nothing#
As with many things in life, doing nothing is an option here. This means
we simply advocate for users and downstream libraries to take advantage
of the split between cbook.boxplot_stats and Axes.bxp and let
them decide how to provide an interface to that.