Animated polar plot with oceanographic data
This post describes how to animate some oceanographic measurements in a tweaked polar plot
Posted
#tutorials
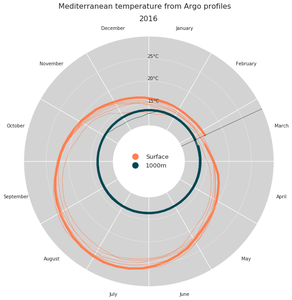
This post describes how to animate some oceanographic measurements in a tweaked polar plot
Posted
#tutorials
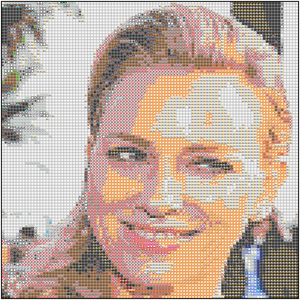
Applied image manipulation to create procedural art.
Posted
#tutorials #art
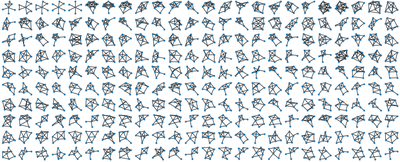
A fun project about drawing all possible differently-looking (not isomorphic) graphs of N nodes.
Posted
#tutorials #graphs
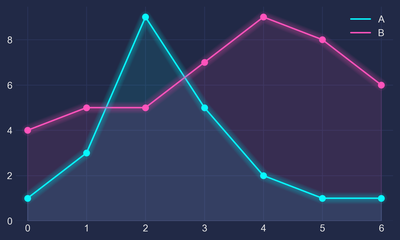
Futuristic neon glow for your next data visualization
Posted
#tutorials