tutorials

Cover page of the IPCC SR15

Figures in the IPCC Special Report on Global Warming of 1.5°C (SR15)

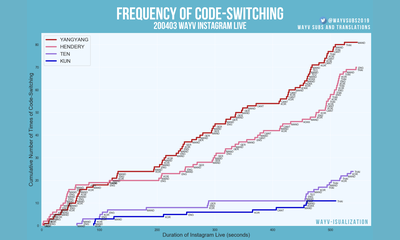
Many figures in the IPCC SR15 were generated using Matplotlib. The data and open-source notebooks were published to increase the transparency and reproducibility of the analysis.

Posted

#academia #tutorials

Visualizing Code-Switching with Step Charts

Learn how to easily create step charts through examining the multilingualism of pop group WayV

Posted

#tutorials #graphs

Rule 110

Elementary Cellular Automata

A brief tour through the world of elementary cellular automata

Posted

#tutorials

Julia Set Fractal

Animate Your Own Fractals in Python with Matplotlib

Discover the bizarre geometry of the fractals and learn how to make an animated visualization of these marvels using Python and the Matplotlib's Animation API.

Posted

#tutorials