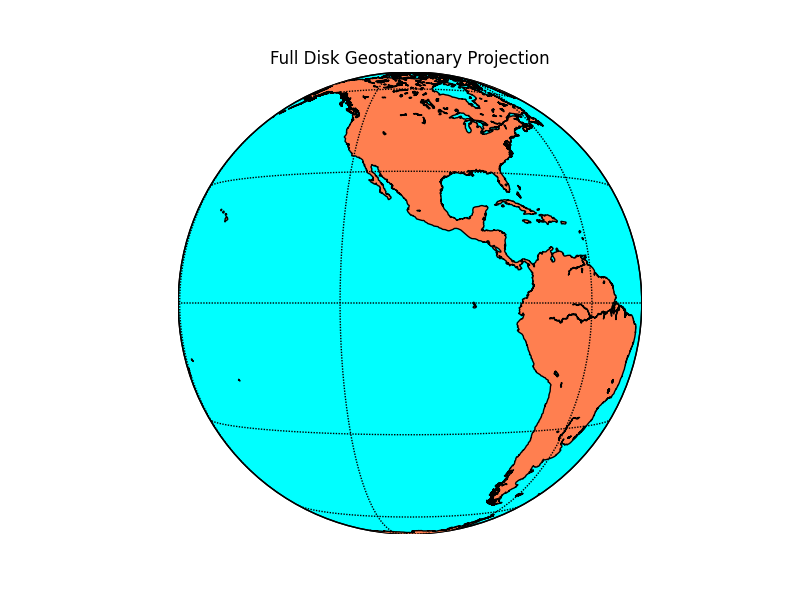
Geostationary Projection
The geostationary projection displays the earth as a satellite (in geostationary orbit) would see it.
from mpl_toolkits.basemap import Basemap
import numpy as np
import matplotlib.pyplot as plt
# lon_0 is the central longitude of the projection.
# resolution = 'l' means use low resolution coastlines.
# optional parameter 'satellite_height' may be used to
# specify height of orbit above earth (default 35,786 km).
m = Basemap(projection='geos',lon_0=-105,resolution='l',rsphere=(6378137.00,6356752.3142))
m.drawcoastlines()
m.fillcontinents(color='coral',lake_color='aqua')
# draw parallels and meridians.
m.drawparallels(np.arange(-90.,120.,30.))
m.drawmeridians(np.arange(0.,420.,60.))
m.drawmapboundary(fill_color='aqua')
plt.title("Full Disk Geostationary Projection")
plt.show()
from mpl_toolkits.basemap import Basemap
import numpy as np
import matplotlib as mpl
import matplotlib.pyplot as plt
mpl_version = tuple(map(int, mpl.__version__.split(".")))
axkwds = {"axisbg" if mpl_version < (2,) else "facecolor": "k"}
fig = plt.figure()
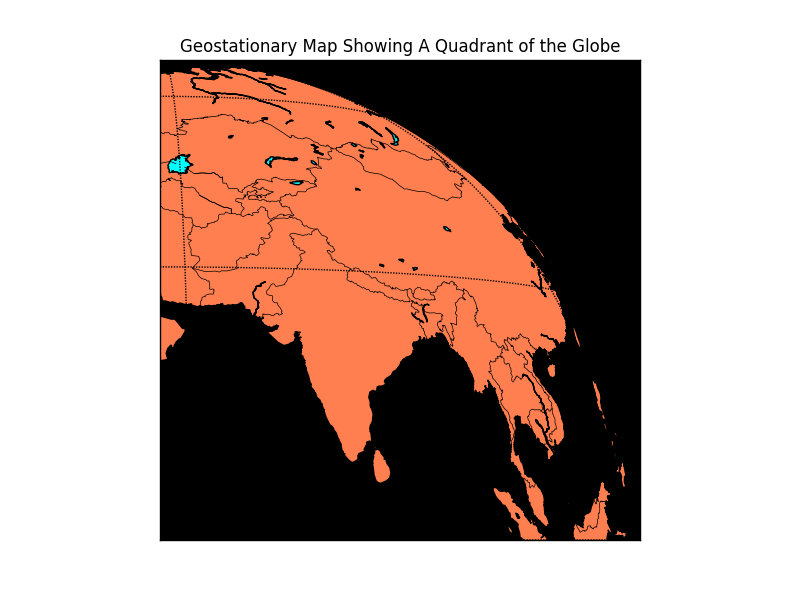
# global geostationary map centered on lon_0
lon_0=57.
# resolution = None means don't process the boundary datasets.
m1 = Basemap(projection='geos',lon_0=lon_0,resolution=None)
# add an axes with a black background
ax = fig.add_axes([0.1,0.1,0.8,0.8], **axkwds)
# plot just upper right quadrant (corners determined from global map).
# keywords llcrnrx,llcrnry,urcrnrx,urcrnry used to define the lower
# left and upper right corners in map projection coordinates.
# llcrnrlat,llcrnrlon,urcrnrlon,urcrnrlat could be used to define
# lat/lon values of corners - but this won't work in cases such as this
# where one of the corners does not lie on the earth.
m = Basemap(projection='geos',lon_0=lon_0,resolution='l',
rsphere=(6378137.00,6356752.3142),
llcrnrx=0.,llcrnry=0.,urcrnrx=m1.urcrnrx/2.,urcrnry=m1.urcrnry/2.)
m.drawcoastlines()
m.drawmapboundary(fill_color='aqua')
m.fillcontinents(color='coral',lake_color='aqua')
m.drawcountries()
# draw parallels and meridians.
m.drawparallels(np.arange(-90.,120.,30.))
m.drawmeridians(np.arange(0.,360.,60.))
m.drawmapboundary()
plt.title('Geostationary Map Showing A Quadrant of the Globe')
plt.show()