Note
Go to the end to download the full example code.
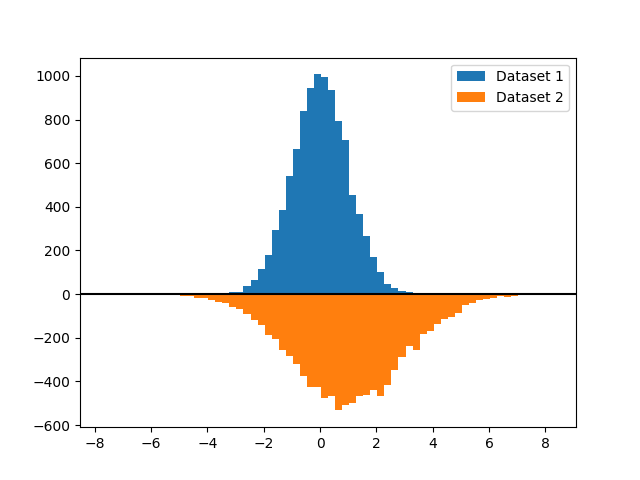
Bihistogram#
How to plot a bihistogram with Matplotlib.
import matplotlib.pyplot as plt
import numpy as np

# Create a random number generator with a fixed seed for reproducibility
rng = np.random.default_rng(19680801)
Generate data and plot a bihistogram#
To generate a bihistogram we need two datasets (each being a vector of numbers). We will plot both histograms using plt.hist() and set the weights of the second one to be negative. We'll generate data below and plot the bihistogram.
N_points = 10_000

# Generate two normal distributions
dataset1 = np.random.normal(0, 1, size=N_points)
dataset2 = np.random.normal(1, 2, size=N_points)

# Use a constant bin width to make the two histograms easier to compare visually
bin_width = 0.25
bins = np.arange(np.min([dataset1, dataset2]),
                    np.max([dataset1, dataset2]) + bin_width, bin_width)

fig, ax = plt.subplots()

# Plot the first histogram
ax.hist(dataset1, bins=bins, label="Dataset 1")

# Plot the second histogram
# (notice the negative weights, which flip the histogram upside down)
ax.hist(dataset2, weights=-np.ones_like(dataset2), bins=bins, label="Dataset 2")
ax.axhline(0, color="k")
ax.legend()

plt.show()