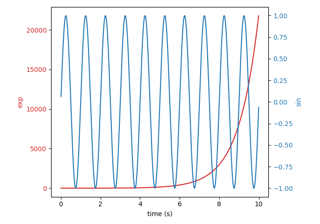
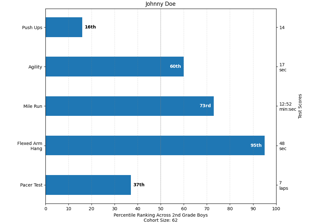
matplotlib.pyplot.twinx# matplotlib.pyplot.twinx(ax=None)[source]# Make and return a second axes that shares the x-axis. The new axes will overlay ax (or the current axes if ax is None), and its ticks will be on the right. Examples Plots with different scales Examples using matplotlib.pyplot.twinx# Plots with different scales Plots with different scales Percentiles as horizontal bar chart Percentiles as horizontal bar chart