Matplotlib Application Interfaces (APIs)#
Matplotlib has two major application interfaces, or styles of using the library:
An explicit "Axes" interface that uses methods on a Figure or Axes object to create other Artists, and build a visualization step by step. This has also been called an "object-oriented" interface.
An implicit "pyplot" interface that keeps track of the last Figure and Axes created, and adds Artists to the object it thinks the user wants.
In addition, a number of downstream libraries (like pandas and xarray) offer
a plot method implemented directly on their data classes so that users can
call data.plot().
The difference between these interfaces can be a bit confusing, particularly given snippets on the web that use one or the other, or sometimes multiple interfaces in the same example. Here we attempt to point out how the "pyplot" and downstream interfaces relate to the explicit "Axes" interface to help users better navigate the library.
Native Matplotlib interfaces#
The explicit "Axes" interface#
The "Axes" interface is how Matplotlib is implemented, and many customizations and fine-tuning end up being done at this level.
This interface works by instantiating an instance of a
Figure class (fig below), using a method
subplots method (or similar) on that object to create one or more
Axes objects (ax below), and then calling drawing
methods on the Axes (plot in this example):
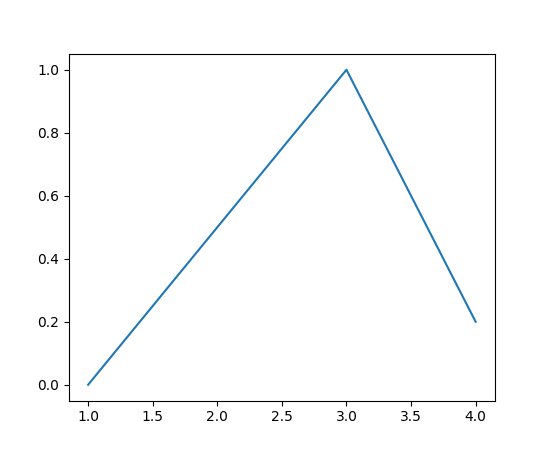
import matplotlib.pyplot as plt

fig = plt.figure()
ax = fig.subplots()
ax.plot([1, 2, 3, 4], [0, 0.5, 1, 0.2])
(Source code, png)

We call this an "explicit" interface because each object is explicitly referenced, and used to make the next object. Keeping references to the objects is very flexible, and allows us to customize the objects after they are created, but before they are displayed.
The implicit "pyplot" interface#
The pyplot module shadows most of the
Axes plotting methods to give the equivalent of
the above, where the creation of the Figure and Axes is done for the user:
import matplotlib.pyplot as plt

plt.plot([1, 2, 3, 4], [0, 0.5, 1, 0.2])
(Source code, png)
This can be convenient, particularly when doing interactive work or simple
scripts. A reference to the current Figure can be retrieved using
gcf and to the current Axes by gca. The pyplot module
retains a list of Figures, and each Figure retains a list of Axes on the figure
for the user so that the following:
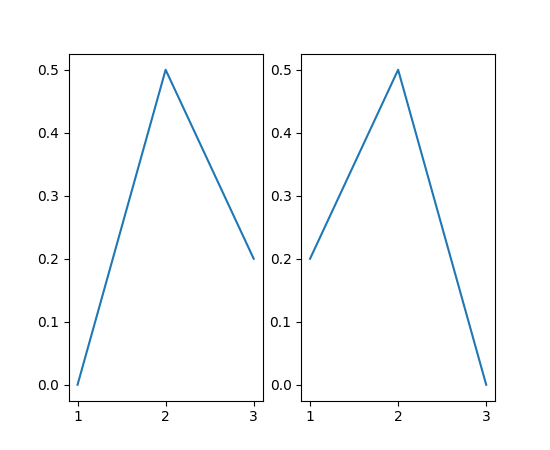
import matplotlib.pyplot as plt

plt.subplot(1, 2, 1)
plt.plot([1, 2, 3], [0, 0.5, 0.2])

plt.subplot(1, 2, 2)
plt.plot([3, 2, 1], [0, 0.5, 0.2])
(Source code, png)

is equivalent to:
import matplotlib.pyplot as plt

plt.subplot(1, 2, 1)
ax = plt.gca()
ax.plot([1, 2, 3], [0, 0.5, 0.2])

plt.subplot(1, 2, 2)
ax = plt.gca()
ax.plot([3, 2, 1], [0, 0.5, 0.2])
(Source code, png)

In the explicit interface, this would be:
import matplotlib.pyplot as plt

fig, axs = plt.subplots(1, 2)
axs[0].plot([1, 2, 3], [0, 0.5, 0.2])
axs[1].plot([3, 2, 1], [0, 0.5, 0.2])
(Source code, png)

Why be explicit?#
What happens if you have to backtrack, and operate on an old axes that is not
referenced by plt.gca()? One simple way is to call subplot again with
the same arguments. However, that quickly becomes inelegant. You can also
inspect the Figure object and get its list of Axes objects, however, that can be
misleading (colorbars are Axes too!). The best solution is probably to save a
handle to every Axes you create, but if you do that, why not simply create the
all the Axes objects at the start?
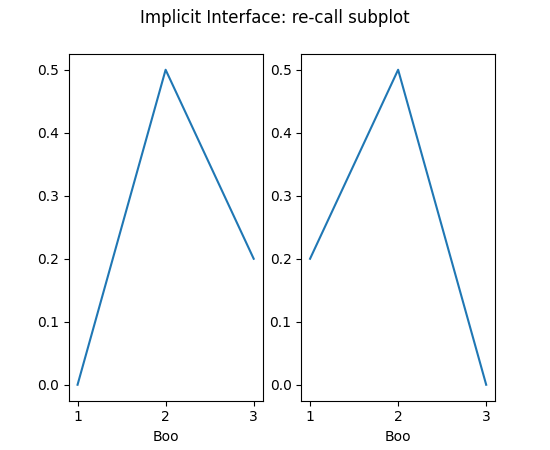
The first approach is to call plt.subplot again:
import matplotlib.pyplot as plt

plt.subplot(1, 2, 1)
plt.plot([1, 2, 3], [0, 0.5, 0.2])

plt.subplot(1, 2, 2)
plt.plot([3, 2, 1], [0, 0.5, 0.2])

plt.suptitle('Implicit Interface: re-call subplot')

for i in range(1, 3):
    plt.subplot(1, 2, i)
    plt.xlabel('Boo')
(Source code, png)

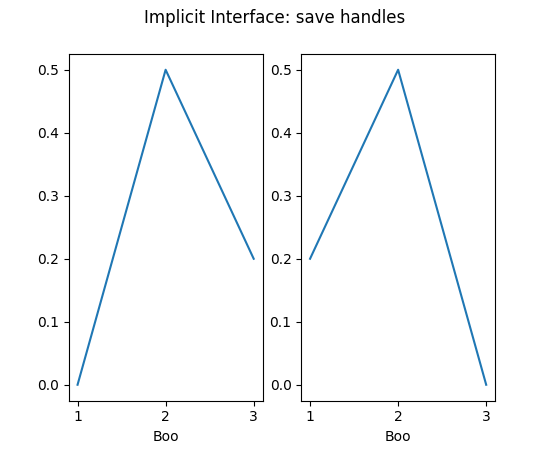
The second is to save a handle:
import matplotlib.pyplot as plt

axs = []
ax = plt.subplot(1, 2, 1)
axs += [ax]
plt.plot([1, 2, 3], [0, 0.5, 0.2])

ax = plt.subplot(1, 2, 2)
axs += [ax]
plt.plot([3, 2, 1], [0, 0.5, 0.2])

plt.suptitle('Implicit Interface: save handles')

for i in range(2):
    plt.sca(axs[i])
    plt.xlabel('Boo')
(Source code, png)

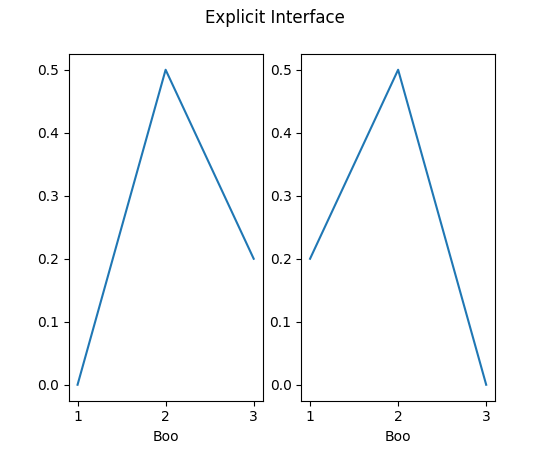
However, the recommended way would be to be explicit from the outset:
import matplotlib.pyplot as plt

fig, axs = plt.subplots(1, 2)
axs[0].plot([1, 2, 3], [0, 0.5, 0.2])
axs[1].plot([3, 2, 1], [0, 0.5, 0.2])
fig.suptitle('Explicit Interface')
for i in range(2):
    axs[i].set_xlabel('Boo')
(Source code, png)

Third-party library "Data-object" interfaces#
Some third party libraries have chosen to implement plotting for their data
objects, e.g. data.plot(), is seen in pandas, xarray, and other
third-party libraries. For illustrative purposes, a downstream library may
implement a simple data container that has x and y data stored together,
and then implements a plot method:
import matplotlib.pyplot as plt

# supplied by downstream library:
class DataContainer:

    def __init__(self, x, y):
        """
        Proper docstring here!
        """
        self._x = x
        self._y = y

    def plot(self, ax=None, **kwargs):
        if ax is None:
            ax = plt.gca()
        ax.plot(self._x, self._y, **kwargs)
        ax.set_title('Plotted from DataClass!')
        return ax


# what the user usually calls:
data = DataContainer([0, 1, 2, 3], [0, 0.2, 0.5, 0.3])
data.plot()
(Source code, png)
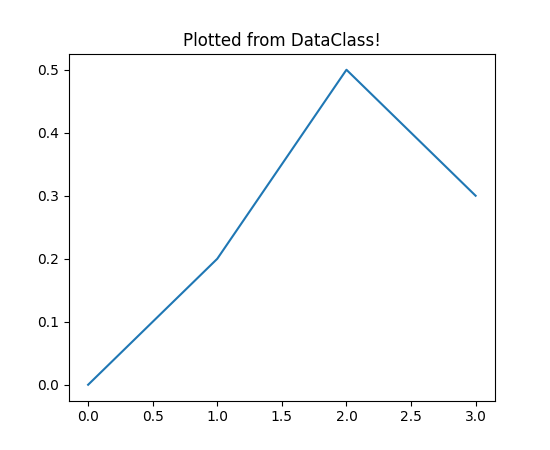
So the library can hide all the nitty-gritty from the user, and can make a visualization appropriate to the data type, often with good labels, choices of colormaps, and other convenient features.
In the above, however, we may not have liked the title the library provided.
Thankfully, they pass us back the Axes from the plot() method, and
understanding the explicit Axes interface, we could call:
ax.set_title('My preferred title') to customize the title.
Many libraries also allow their plot methods to accept an optional ax
argument. This allows us to place the visualization in an Axes that we have
placed and perhaps customized.
Summary#
Overall, it is useful to understand the explicit "Axes" interface since it is the most flexible and underlies the other interfaces. A user can usually figure out how to drop down to the explicit interface and operate on the underlying objects. While the explicit interface can be a bit more verbose to setup, complicated plots will often end up simpler than trying to use the implicit "pyplot" interface.
Note
It is sometimes confusing to people that we import pyplot for both
interfaces. Currently, the pyplot module implements the "pyplot"
interface, but it also provides top-level Figure and Axes creation
methods, and ultimately spins up the graphical user interface, if one
is being used. So pyplot is still needed regardless of the
interface chosen.
Similarly, the declarative interfaces provided by partner libraries use the objects accessible by the "Axes" interface, and often accept these as arguments or pass them back from methods. It is usually essential to use the explicit "Axes" interface to perform any customization of the default visualization, or to unpack the data into NumPy arrays and pass directly to Matplotlib.
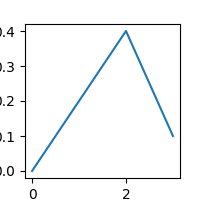
Appendix: "Axes" interface with data structures#
Most Axes methods allow yet another API addressing by passing a
data object to the method and specifying the arguments as strings:
import matplotlib.pyplot as plt

data = {'xdat': [0, 1, 2, 3], 'ydat': [0, 0.2, 0.4, 0.1]}
fig, ax = plt.subplots(figsize=(2, 2))
ax.plot('xdat', 'ydat', data=data)
(Source code, png)
Appendix: "pylab" interface#
There is one further interface that is highly discouraged, and that is to
basically do from matplotlib.pyplot import *. This allows users to simply
call plot(x, y). While convenient, this can lead to obvious problems if the
user unwittingly names a variable the same name as a pyplot method.