Note
Click here to download the full example code
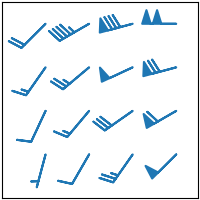
barbs(X, Y, U, V)#
See barbs.
import matplotlib.pyplot as plt
import numpy as np

plt.style.use('_mpl-gallery-nogrid')

# make data:
X, Y = np.meshgrid([1, 2, 3, 4], [1, 2, 3, 4])
angle = np.pi / 180 * np.array([[15., 30, 35, 45],
                                [25., 40, 55, 60],
                                [35., 50, 65, 75],
                                [45., 60, 75, 90]])
amplitude = np.array([[5, 10, 25, 50],
                      [10, 15, 30, 60],
                      [15, 26, 50, 70],
                      [20, 45, 80, 100]])
U = amplitude * np.sin(angle)
V = amplitude * np.cos(angle)

# plot:
fig, ax = plt.subplots()

ax.barbs(X, Y, U, V, barbcolor='C0', flagcolor='C0', length=7, linewidth=1.5)

ax.set(xlim=(0, 4.5), ylim=(0, 4.5))

plt.show()
Keywords: matplotlib code example, codex, python plot, pyplot Gallery generated by Sphinx-Gallery