matplotlib.axes.Axes.hist#
- Axes.hist(x, bins=None, range=None, density=False, weights=None, cumulative=False, bottom=None, histtype='bar', align='mid', orientation='vertical', rwidth=None, log=False, color=None, label=None, stacked=False, *, data=None, **kwargs)[source]#
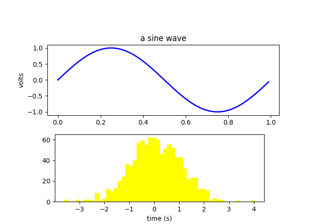
Plot a histogram.
Compute and draw the histogram of x. The return value is a tuple (n, bins, patches) or ([n0, n1, ...], bins, [patches0, patches1, ...]) if the input contains multiple data. See the documentation of the weights parameter to draw a histogram of already-binned data.
Multiple data can be provided via x as a list of datasets of potentially different length ([x0, x1, ...]), or as a 2D ndarray in which each column is a dataset. Note that the ndarray form is transposed relative to the list form.
Masked arrays are not supported.
The bins, range, weights, and density parameters behave as in
numpy.histogram.- Parameters
- x(n,) array or sequence of (n,) arrays
Input values, this takes either a single array or a sequence of arrays which are not required to be of the same length.
- binsint or sequence or str, default:
rcParams["hist.bins"](default:10) If bins is an integer, it defines the number of equal-width bins in the range.
If bins is a sequence, it defines the bin edges, including the left edge of the first bin and the right edge of the last bin; in this case, bins may be unequally spaced. All but the last (righthand-most) bin is half-open. In other words, if bins is:
[1, 2, 3, 4]
then the first bin is
[1, 2)(including 1, but excluding 2) and the second[2, 3). The last bin, however, is[3, 4], which includes 4.If bins is a string, it is one of the binning strategies supported by
numpy.histogram_bin_edges: 'auto', 'fd', 'doane', 'scott', 'stone', 'rice', 'sturges', or 'sqrt'.- rangetuple or None, default: None
The lower and upper range of the bins. Lower and upper outliers are ignored. If not provided, range is
(x.min(), x.max()). Range has no effect if bins is a sequence.If bins is a sequence or range is specified, autoscaling is based on the specified bin range instead of the range of x.
- densitybool, default: False
If
True, draw and return a probability density: each bin will display the bin's raw count divided by the total number of counts and the bin width (density = counts / (sum(counts) * np.diff(bins))), so that the area under the histogram integrates to 1 (np.sum(density * np.diff(bins)) == 1).If stacked is also
True, the sum of the histograms is normalized to 1.- weights(n,) array-like or None, default: None
An array of weights, of the same shape as x. Each value in x only contributes its associated weight towards the bin count (instead of 1). If density is
True, the weights are normalized, so that the integral of the density over the range remains 1.This parameter can be used to draw a histogram of data that has already been binned, e.g. using
numpy.histogram(by treating each bin as a single point with a weight equal to its count)counts, bins = np.histogram(data) plt.hist(bins[:-1], bins, weights=counts)
(or you may alternatively use
bar()).- cumulativebool or -1, default: False
If
True, then a histogram is computed where each bin gives the counts in that bin plus all bins for smaller values. The last bin gives the total number of datapoints.If density is also
Truethen the histogram is normalized such that the last bin equals 1.If cumulative is a number less than 0 (e.g., -1), the direction of accumulation is reversed. In this case, if density is also
True, then the histogram is normalized such that the first bin equals 1.- bottomarray-like, scalar, or None, default: None
Location of the bottom of each bin, ie. bins are drawn from
bottomtobottom + hist(x, bins)If a scalar, the bottom of each bin is shifted by the same amount. If an array, each bin is shifted independently and the length of bottom must match the number of bins. If None, defaults to 0.- histtype{'bar', 'barstacked', 'step', 'stepfilled'}, default: 'bar'
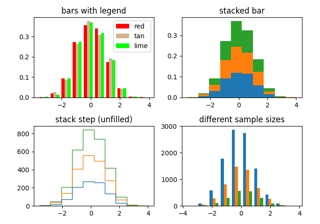
The type of histogram to draw.
'bar' is a traditional bar-type histogram. If multiple data are given the bars are arranged side by side.
'barstacked' is a bar-type histogram where multiple data are stacked on top of each other.
'step' generates a lineplot that is by default unfilled.
'stepfilled' generates a lineplot that is by default filled.
- align{'left', 'mid', 'right'}, default: 'mid'
The horizontal alignment of the histogram bars.
'left': bars are centered on the left bin edges.
'mid': bars are centered between the bin edges.
'right': bars are centered on the right bin edges.
- orientation{'vertical', 'horizontal'}, default: 'vertical'
If 'horizontal',
barhwill be used for bar-type histograms and the bottom kwarg will be the left edges.- rwidthfloat or None, default: None
The relative width of the bars as a fraction of the bin width. If
None, automatically compute the width.Ignored if histtype is 'step' or 'stepfilled'.
- logbool, default: False
If
True, the histogram axis will be set to a log scale.- colorcolor or array-like of colors or None, default: None
Color or sequence of colors, one per dataset. Default (
None) uses the standard line color sequence.- labelstr or None, default: None
String, or sequence of strings to match multiple datasets. Bar charts yield multiple patches per dataset, but only the first gets the label, so that
legendwill work as expected.- stackedbool, default: False
If
True, multiple data are stacked on top of each other IfFalsemultiple data are arranged side by side if histtype is 'bar' or on top of each other if histtype is 'step'
- Returns
- narray or list of arrays
The values of the histogram bins. See density and weights for a description of the possible semantics. If input x is an array, then this is an array of length nbins. If input is a sequence of arrays
[data1, data2, ...], then this is a list of arrays with the values of the histograms for each of the arrays in the same order. The dtype of the array n (or of its element arrays) will always be float even if no weighting or normalization is used.- binsarray
The edges of the bins. Length nbins + 1 (nbins left edges and right edge of last bin). Always a single array even when multiple data sets are passed in.
- patches
BarContaineror list of a singlePolygonor list of such objects Container of individual artists used to create the histogram or list of such containers if there are multiple input datasets.
- Other Parameters
- dataindexable object, optional
If given, the following parameters also accept a string
s, which is interpreted asdata[s](unless this raises an exception):x, weights
- **kwargs
Patchproperties
Notes
For large numbers of bins (>1000), 'step' and 'stepfilled' can be significantly faster than 'bar' and 'barstacked'.