Getting started
Installation quick-start
Further details are available in the Installation Guide.
Draw a first plot
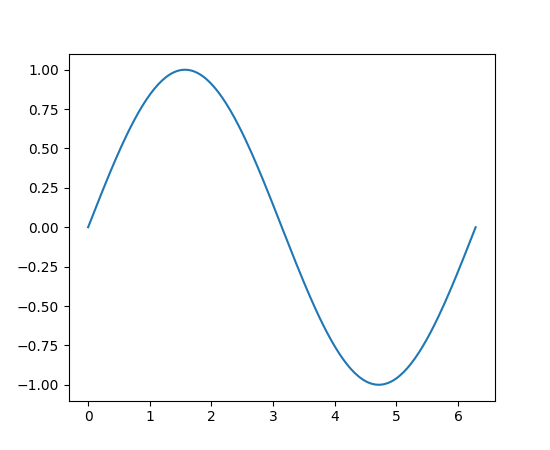
Here is a minimal example plot:
import matplotlib.pyplot as plt
import numpy as np

x = np.linspace(0, 2 * np.pi, 200)
y = np.sin(x)

fig, ax = plt.subplots()
ax.plot(x, y)
plt.show()
(Source code, png, pdf)
If a plot does not show up please check Troubleshooting.
Where to go next
Check out Plot types to get an overview of the types of plots you can create with Matplotlib.
Learn Matplotlib from the ground up in the Quick-start guide.