Note
Click here to download the full example code
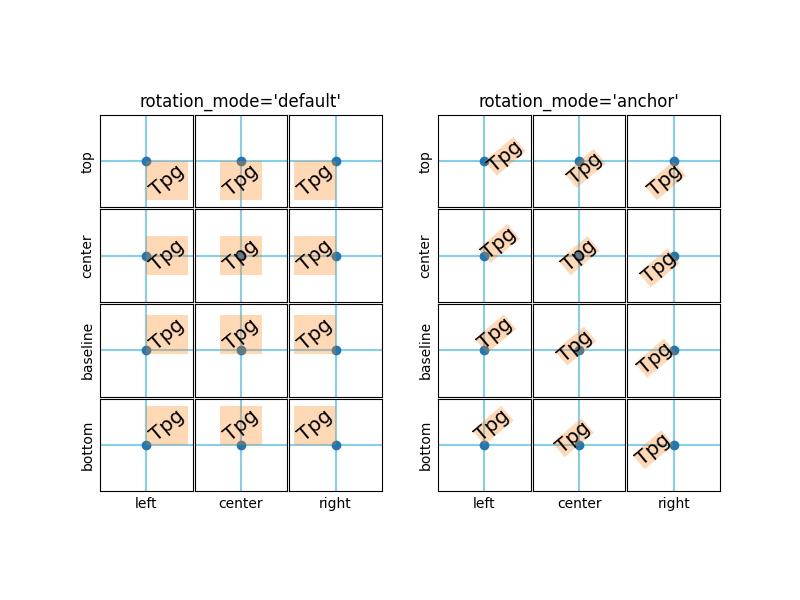
Text Rotation Mode
This example illustrates the effect of rotation_mode on the positioning
of rotated text.
Rotated Texts are created by passing the parameter rotation to
the constructor or the axes' method text.
The actual positioning depends on the additional parameters
horizontalalignment, verticalalignment and rotation_mode.
rotation_mode determines the order of rotation and alignment:
rotation_mode='default'(or None) first rotates the text and then aligns the bounding box of the rotated text.rotation_mode='anchor'aligns the unrotated text and then rotates the text around the point of alignment.
import matplotlib.pyplot as plt
from mpl_toolkits.axes_grid1.axes_grid import ImageGrid


def test_rotation_mode(fig, mode, subplot_location):
    ha_list = ["left", "center", "right"]
    va_list = ["top", "center", "baseline", "bottom"]
    grid = ImageGrid(fig, subplot_location,
                     nrows_ncols=(len(va_list), len(ha_list)),
                     share_all=True, aspect=True, cbar_mode=None)

    # labels and title
    for ha, ax in zip(ha_list, grid.axes_row[-1]):
        ax.axis["bottom"].label.set_text(ha)
    for va, ax in zip(va_list, grid.axes_column[0]):
        ax.axis["left"].label.set_text(va)
    grid.axes_row[0][1].set_title(f"rotation_mode='{mode}'", size="large")

    if mode == "default":
        kw = dict()
    else:
        kw = dict(
            bbox=dict(boxstyle="square,pad=0.", ec="none", fc="C1", alpha=0.3))

    # use a different text alignment in each axes
    texts = []
    for (va, ha), ax in zip([(x, y) for x in va_list for y in ha_list], grid):
        # prepare axes layout
        for axis in ax.axis.values():
            axis.toggle(ticks=False, ticklabels=False)
        ax.axvline(0.5, color="skyblue", zorder=0)
        ax.axhline(0.5, color="skyblue", zorder=0)
        ax.plot(0.5, 0.5, color="C0", marker="o", zorder=1)

        # add text with rotation and alignment settings
        tx = ax.text(0.5, 0.5, "Tpg",
                     size="x-large", rotation=40,
                     horizontalalignment=ha, verticalalignment=va,
                     rotation_mode=mode, **kw)
        texts.append(tx)

    if mode == "default":
        # highlight bbox
        fig.canvas.draw()
        for ax, tx in zip(grid, texts):
            bb = tx.get_window_extent().transformed(ax.transData.inverted())
            rect = plt.Rectangle((bb.x0, bb.y0), bb.width, bb.height,
                                 facecolor="C1", alpha=0.3, zorder=2)
            ax.add_patch(rect)


fig = plt.figure(figsize=(8, 6))
test_rotation_mode(fig, "default", 121)
test_rotation_mode(fig, "anchor", 122)
plt.show()
References
The use of the following functions, methods, classes and modules is shown in this example:
Total running time of the script: ( 0 minutes 1.574 seconds)
Keywords: matplotlib code example, codex, python plot, pyplot Gallery generated by Sphinx-Gallery