Note
Click here to download the full example code
Placing Colorbars
Colorbars indicate the quantitative extent of image data. Placing in a figure is non-trivial because room needs to be made for them.
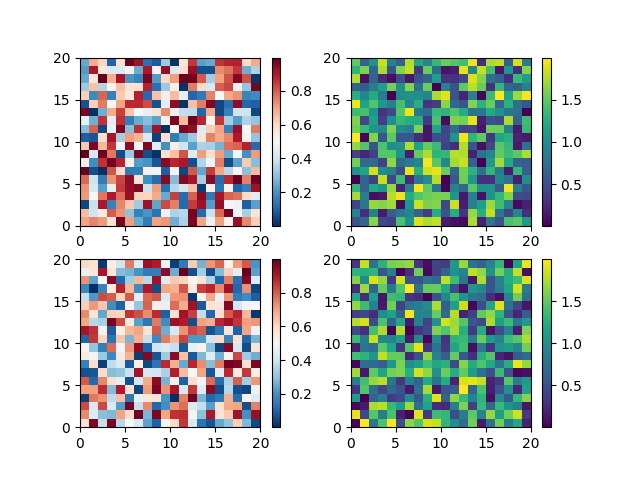
The simplest case is just attaching a colorbar to each axes:
import matplotlib.pyplot as plt
import numpy as np


# Fixing random state for reproducibility
np.random.seed(19680801)

fig, axs = plt.subplots(2, 2)
cmaps = ['RdBu_r', 'viridis']
for col in range(2):
    for row in range(2):
        ax = axs[row, col]
        pcm = ax.pcolormesh(np.random.random((20, 20)) * (col + 1),
                            cmap=cmaps[col])
        fig.colorbar(pcm, ax=ax)
plt.show()
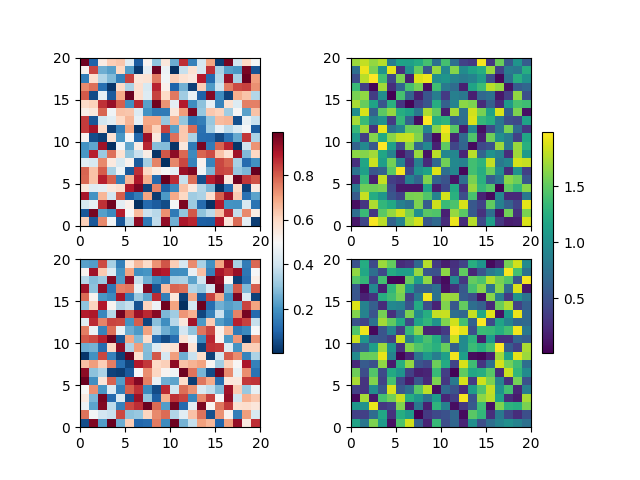
The first column has the same type of data in both rows, so it may
be desirable to combine the colorbar which we do by calling
Figure.colorbar with a list of axes instead of a single axes.
fig, axs = plt.subplots(2, 2)
cmaps = ['RdBu_r', 'viridis']
for col in range(2):
    for row in range(2):
        ax = axs[row, col]
        pcm = ax.pcolormesh(np.random.random((20, 20)) * (col + 1),
                            cmap=cmaps[col])
    fig.colorbar(pcm, ax=axs[:, col], shrink=0.6)
plt.show()
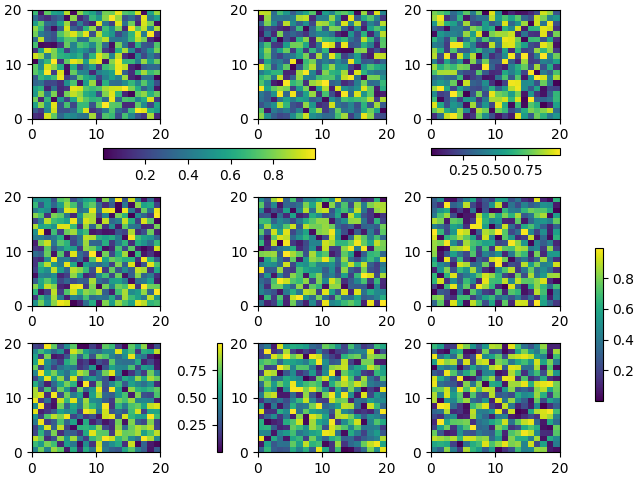
Relatively complicated colorbar layouts are possible using this
paradigm. Note that this example works far better with
constrained_layout=True
fig, axs = plt.subplots(3, 3, constrained_layout=True)
for ax in axs.flat:
    pcm = ax.pcolormesh(np.random.random((20, 20)))

fig.colorbar(pcm, ax=axs[0, :2], shrink=0.6, location='bottom')
fig.colorbar(pcm, ax=[axs[0, 2]], location='bottom')
fig.colorbar(pcm, ax=axs[1:, :], location='right', shrink=0.6)
fig.colorbar(pcm, ax=[axs[2, 1]], location='left')
plt.show()
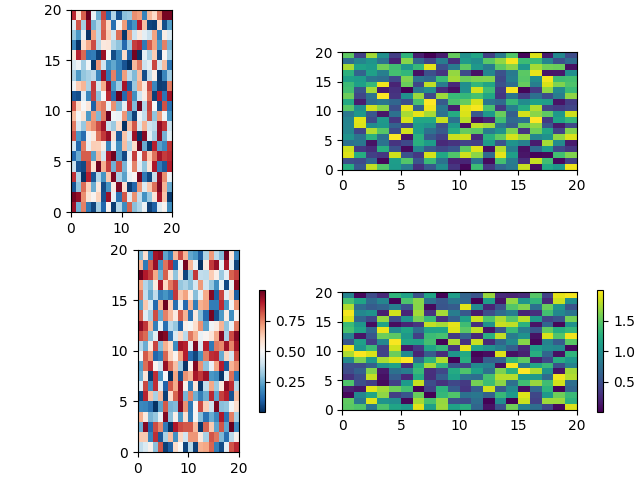
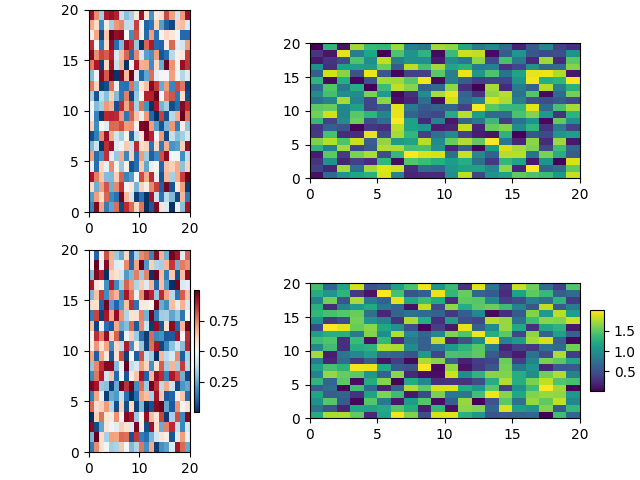
Colorbars with fixed-aspect-ratio axes
Placing colorbars for axes with a fixed aspect ratio pose a particular challenge as the parent axes changes size depending on the data view.
fig, axs = plt.subplots(2, 2,  constrained_layout=True)
cmaps = ['RdBu_r', 'viridis']
for col in range(2):
    for row in range(2):
        ax = axs[row, col]
        pcm = ax.pcolormesh(np.random.random((20, 20)) * (col + 1),
                            cmap=cmaps[col])
        if col == 0:
            ax.set_aspect(2)
        else:
            ax.set_aspect(1/2)
        if row == 1:
            fig.colorbar(pcm, ax=ax, shrink=0.6)
plt.show()
One way around this issue is to use an Axes.inset_axes to locate the
axes in axes co-ordinates. Note that if you zoom in on the axes, and
change the shape of the axes, the colorbar will also change position.
fig, axs = plt.subplots(2, 2, constrained_layout=True)
cmaps = ['RdBu_r', 'viridis']
for col in range(2):
    for row in range(2):
        ax = axs[row, col]
        pcm = ax.pcolormesh(np.random.random((20, 20)) * (col + 1),
                            cmap=cmaps[col])
        if col == 0:
            ax.set_aspect(2)
        else:
            ax.set_aspect(1/2)
        if row == 1:
            cax = ax.inset_axes([1.04, 0.2, 0.05, 0.6], transform=ax.transAxes)
            fig.colorbar(pcm, ax=ax, cax=cax)
plt.show()
Total running time of the script: ( 0 minutes 3.095 seconds)
Keywords: matplotlib code example, codex, python plot, pyplot Gallery generated by Sphinx-Gallery