Note
Click here to download the full example code
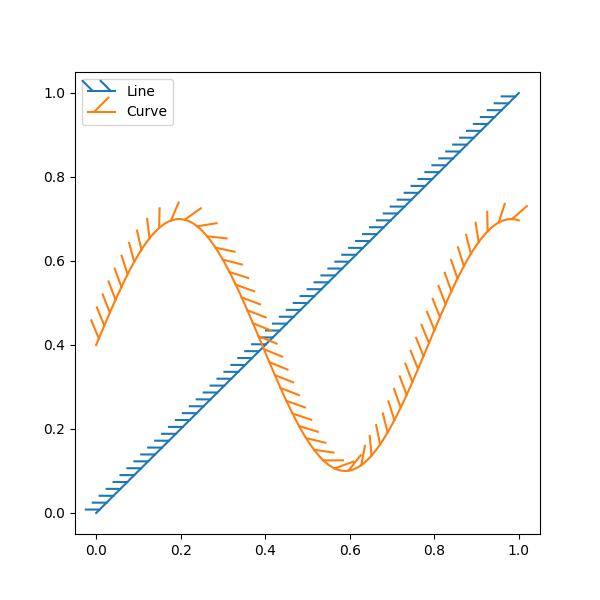
Lines with a ticked patheffect
Ticks can be added along a line to mark one side as a barrier using
TickedStroke. You can control the angle,
spacing, and length of the ticks.
The ticks will also appear appropriately in the legend.
import numpy as np
import matplotlib.pyplot as plt
from matplotlib import patheffects

fig, ax = plt.subplots(figsize=(6, 6))
ax.plot([0, 1], [0, 1], label="Line",
        path_effects=[patheffects.withTickedStroke(spacing=7, angle=135)])

nx = 101
x = np.linspace(0.0, 1.0, nx)
y = 0.3*np.sin(x*8) + 0.4
ax.plot(x, y, label="Curve", path_effects=[patheffects.withTickedStroke()])

ax.legend()

plt.show()
Keywords: matplotlib code example, codex, python plot, pyplot Gallery generated by Sphinx-Gallery