Note
Click here to download the full example code
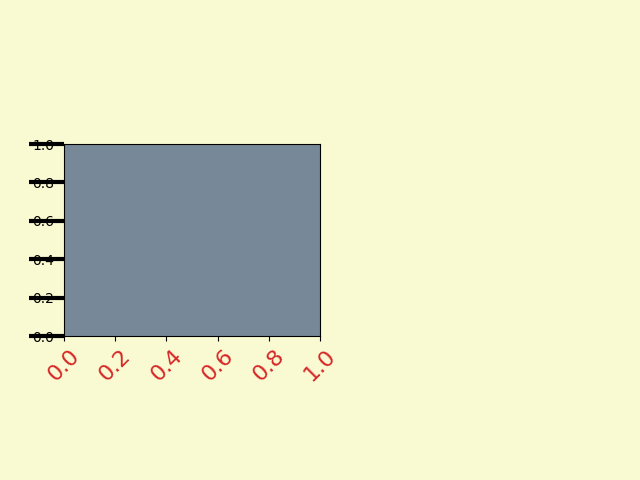
Fig Axes Customize Simple
Customize the background, labels and ticks of a simple plot.
import matplotlib.pyplot as plt
pyplot.figure creates a matplotlib.figure.Figure instance.
fig = plt.figure()
rect = fig.patch  # a rectangle instance
rect.set_facecolor('lightgoldenrodyellow')

ax1 = fig.add_axes([0.1, 0.3, 0.4, 0.4])
rect = ax1.patch
rect.set_facecolor('lightslategray')


for label in ax1.xaxis.get_ticklabels():
    # label is a Text instance
    label.set_color('tab:red')
    label.set_rotation(45)
    label.set_fontsize(16)

for line in ax1.yaxis.get_ticklines():
    # line is a Line2D instance
    line.set_color('tab:green')
    line.set_markersize(25)
    line.set_markeredgewidth(3)

plt.show()
References
The use of the following functions, methods, classes and modules is shown in this example:
matplotlib.axis.Axis.get_ticklabelsmatplotlib.axis.Axis.get_ticklinesmatplotlib.text.Text.set_rotationmatplotlib.text.Text.set_fontsizematplotlib.text.Text.set_colormatplotlib.lines.Line2Dmatplotlib.lines.Line2D.set_colormatplotlib.lines.Line2D.set_markersizematplotlib.lines.Line2D.set_markeredgewidthmatplotlib.patches.Patch.set_facecolor
Keywords: matplotlib code example, codex, python plot, pyplot Gallery generated by Sphinx-Gallery