How-to
Contents
- How-to
- Check whether a figure is empty
- Find all objects in a figure of a certain type
- Prevent ticklabels from having an offset
- Save transparent figures
- Save multiple plots to one pdf file
- Move the edge of an axes to make room for tick labels
- Automatically make room for tick labels
- Align my ylabels across multiple subplots
- Control the draw order of plot elements
- Make the aspect ratio for plots equal
- Draw multiple y-axis scales
- Generate images without having a window appear
- Work with threads
Check whether a figure is empty
Empty can actually mean different things. Does the figure contain any artists?
Does a figure with an empty Axes still count as empty? Is the figure
empty if it was rendered pure white (there may be artists present, but they
could be outside the drawing area or transparent)?
For the purpose here, we define empty as: "The figure does not contain any
artists except it's background patch." The exception for the background is
necessary, because by default every figure contains a Rectangle as it's
background patch. This definition could be checked via:
def is_empty(figure):
    """
    Return whether the figure contains no Artists (other than the default
    background patch).
    """
    contained_artists = figure.get_children()
    return len(contained_artists) <= 1
We've decided not to include this as a figure method because this is only one way of defining empty, and checking the above is only rarely necessary. Usually the user or program handling the figure know if they have added something to the figure.
Checking whether a figure would render empty cannot be reliably checked except by actually rendering the figure and investigating the rendered result.
Find all objects in a figure of a certain type
Every Matplotlib artist (see Artist tutorial) has a method
called findobj() that can be used to
recursively search the artist for any artists it may contain that meet
some criteria (e.g., match all Line2D
instances or match some arbitrary filter function). For example, the
following snippet finds every object in the figure which has a
set_color property and makes the object blue:
def myfunc(x):
    return hasattr(x, 'set_color')

for o in fig.findobj(myfunc):
    o.set_color('blue')
You can also filter on class instances:
import matplotlib.text as text
for o in fig.findobj(text.Text):
    o.set_fontstyle('italic')
Prevent ticklabels from having an offset
The default formatter will use an offset to reduce the length of the ticklabels. To turn this feature off on a per-axis basis:
ax.get_xaxis().get_major_formatter().set_useOffset(False)
set rcParams["axes.formatter.useoffset"] (default: True), or use a different
formatter. See ticker for details.
Save transparent figures
The savefig() command has a keyword argument
transparent which, if 'True', will make the figure and axes
backgrounds transparent when saving, but will not affect the displayed
image on the screen.
If you need finer grained control, e.g., you do not want full transparency
or you want to affect the screen displayed version as well, you can set
the alpha properties directly. The figure has a
Rectangle instance called patch
and the axes has a Rectangle instance called patch. You can set
any property on them directly (facecolor, edgecolor, linewidth,
linestyle, alpha). e.g.:
fig = plt.figure()
fig.patch.set_alpha(0.5)
ax = fig.add_subplot(111)
ax.patch.set_alpha(0.5)
If you need all the figure elements to be transparent, there is currently no global alpha setting, but you can set the alpha channel on individual elements, e.g.:
ax.plot(x, y, alpha=0.5)
ax.set_xlabel('volts', alpha=0.5)
Save multiple plots to one pdf file
Many image file formats can only have one image per file, but some formats support multi-page files. Currently only the pdf backend has support for this. To make a multi-page pdf file, first initialize the file:
from matplotlib.backends.backend_pdf import PdfPages
pp = PdfPages('multipage.pdf')
You can give the PdfPages
object to savefig(), but you have to specify
the format:
plt.savefig(pp, format='pdf')
An easier way is to call
PdfPages.savefig:
pp.savefig()
Finally, the multipage pdf object has to be closed:
pp.close()
The same can be done using the pgf backend:
from matplotlib.backends.backend_pgf import PdfPages
Move the edge of an axes to make room for tick labels
For subplots, you can control the default spacing on the left, right,
bottom, and top as well as the horizontal and vertical spacing between
multiple rows and columns using the
matplotlib.figure.Figure.subplots_adjust() method (in pyplot it
is subplots_adjust()). For example, to move
the bottom of the subplots up to make room for some rotated x tick
labels:
fig = plt.figure()
fig.subplots_adjust(bottom=0.2)
ax = fig.add_subplot(111)
You can control the defaults for these parameters in your
matplotlibrc file; see Customizing Matplotlib with style sheets and rcParams. For
example, to make the above setting permanent, you would set:
figure.subplot.bottom : 0.2 # the bottom of the subplots of the figure
The other parameters you can configure are, with their defaults
- left = 0.125
- the left side of the subplots of the figure
- right = 0.9
- the right side of the subplots of the figure
- bottom = 0.1
- the bottom of the subplots of the figure
- top = 0.9
- the top of the subplots of the figure
- wspace = 0.2
- the amount of width reserved for space between subplots, expressed as a fraction of the average axis width
- hspace = 0.2
- the amount of height reserved for space between subplots, expressed as a fraction of the average axis height
If you want additional control, you can create an
Axes using the
axes() command (or equivalently the figure
add_axes() method), which allows you to
specify the location explicitly:
ax = fig.add_axes([left, bottom, width, height])
where all values are in fractional (0 to 1) coordinates. See Axes Demo for an example of placing axes manually.
Automatically make room for tick labels
Note
This is now easier to handle than ever before.
Calling tight_layout() or alternatively using
constrained_layout=True argument in subplots()
can fix many common layout issues. See the
Tight Layout guide and
Constrained Layout Guide for more details.
The information below is kept here in case it is useful for other purposes.
In most use cases, it is enough to simply change the subplots adjust
parameters as described in Move the edge of an axes to make room for tick labels. But in some
cases, you don't know ahead of time what your tick labels will be, or
how large they will be (data and labels outside your control may be
being fed into your graphing application), and you may need to
automatically adjust your subplot parameters based on the size of the
tick labels. Any Text instance can report
its extent in window coordinates (a negative x coordinate is outside
the window), but there is a rub.
The RendererBase instance, which is
used to calculate the text size, is not known until the figure is
drawn (draw()). After the window is
drawn and the text instance knows its renderer, you can call
get_window_extent(). One way to solve
this chicken and egg problem is to wait until the figure is draw by
connecting
(mpl_connect()) to the
"on_draw" signal (DrawEvent) and
get the window extent there, and then do something with it, e.g., move
the left of the canvas over; see Event handling and picking.
Here is an example that gets a bounding box in relative figure coordinates (0..1) of each of the labels and uses it to move the left of the subplots over so that the tick labels fit in the figure:
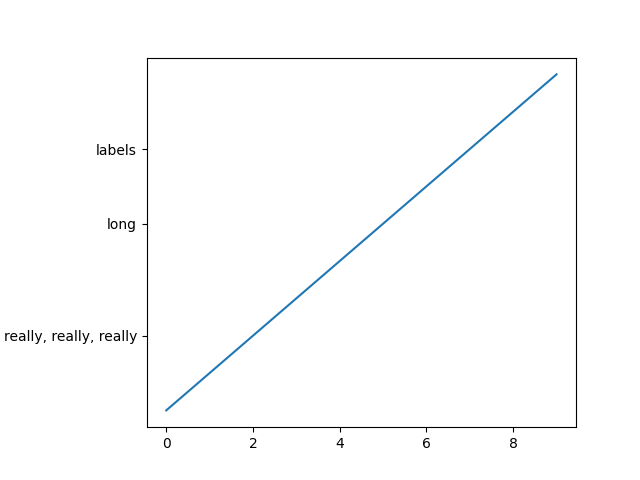
Auto Subplots Adjust
Align my ylabels across multiple subplots
If you have multiple subplots over one another, and the y data have different scales, you can often get ylabels that do not align vertically across the multiple subplots, which can be unattractive. By default, Matplotlib positions the x location of the ylabel so that it does not overlap any of the y ticks. You can override this default behavior by specifying the coordinates of the label. The example below shows the default behavior in the left subplots, and the manual setting in the right subplots.
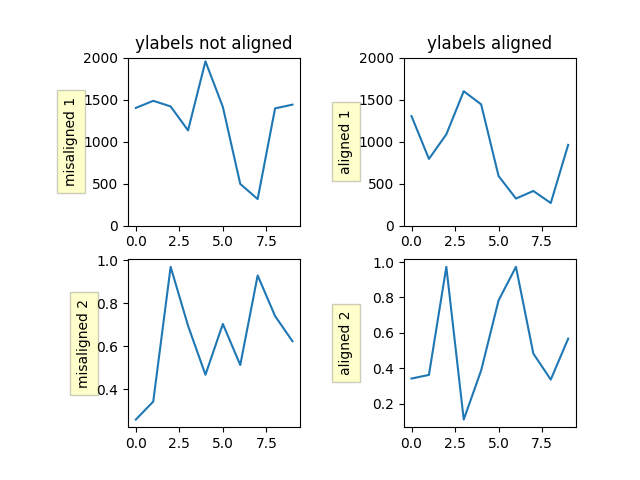
Align Ylabels
Control the draw order of plot elements
The draw order of plot elements, and thus which elements will be on top, is
determined by the set_zorder property.
See Zorder Demo for a detailed description.
Make the aspect ratio for plots equal
The Axes property set_aspect() controls the
aspect ratio of the axes. You can set it to be 'auto', 'equal', or
some ratio which controls the ratio:
ax = fig.add_subplot(111, aspect='equal')
See Equal axis aspect ratio for a complete example.
Draw multiple y-axis scales
A frequent request is to have two scales for the left and right
y-axis, which is possible using twinx() (more
than two scales are not currently supported, though it is on the wish
list). This works pretty well, though there are some quirks when you
are trying to interactively pan and zoom, because both scales do not get
the signals.
The approach uses twinx() (and its sister
twiny()) to use 2 different axes,
turning the axes rectangular frame off on the 2nd axes to keep it from
obscuring the first, and manually setting the tick locs and labels as
desired. You can use separate matplotlib.ticker formatters and
locators as desired because the two axes are independent.
(Source code, png, pdf)
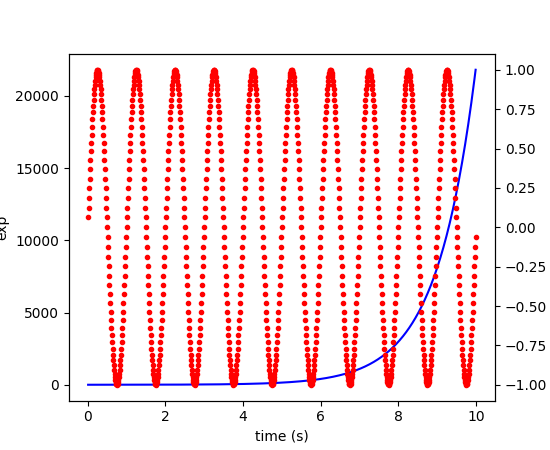
See Plots with different scales for a complete example.
Generate images without having a window appear
Simply do not call show, and directly save the figure to
the desired format:
import matplotlib.pyplot as plt
plt.plot([1, 2, 3])
plt.savefig('myfig.png')
See also
Embedding in a web application server (Flask) for information about running matplotlib inside of a web application.
Work with threads
Matplotlib is not thread-safe: in fact, there are known race conditions that affect certain artists. Hence, if you work with threads, it is your responsibility to set up the proper locks to serialize access to Matplotlib artists.
You may be able to work on separate figures from separate threads. However, you must in that case use a non-interactive backend (typically Agg), because most GUI backends require being run from the main thread as well.