Note
Click here to download the full example code
Autoscaling
The limits on an axis can be set manually (e.g. ax.set_xlim(xmin, xmax))
or Matplotlib can set them automatically based on the data already on the axes.
There are a number of options to this autoscaling behaviour, discussed below.
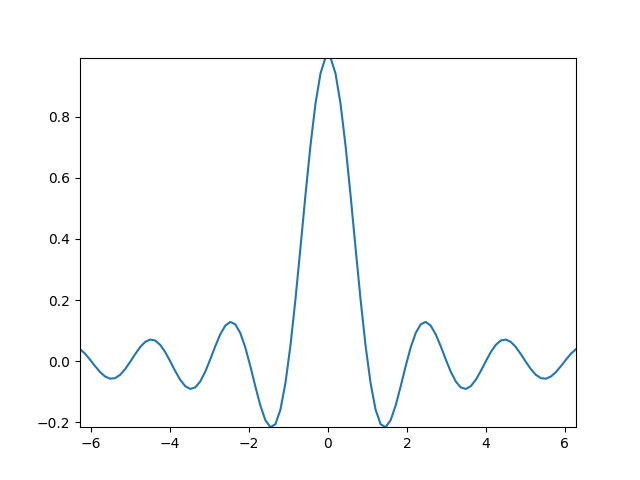
We will start with a simple line plot showing that autoscaling extends the axis limits 5% beyond the data limits (-2π, 2π).
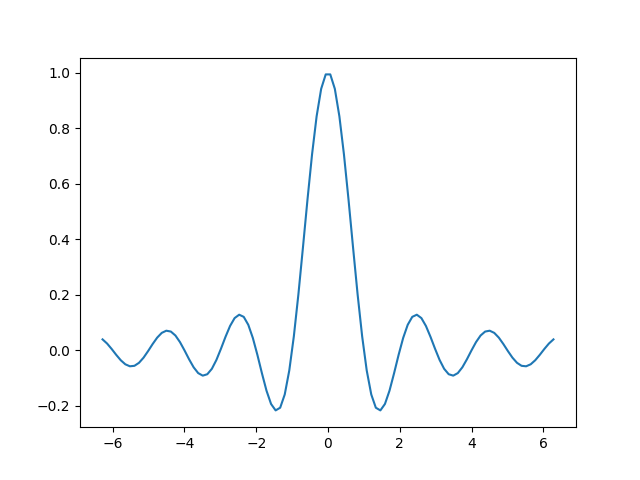
Out:
[<matplotlib.lines.Line2D object at 0x7f5efbf397f0>]
Margins
The default margin around the data limits is 5%:
Out:
(0.05, 0.05)
The margins can be made larger using margins:
fig, ax = plt.subplots()
ax.plot(x, y)
ax.margins(0.2, 0.2)
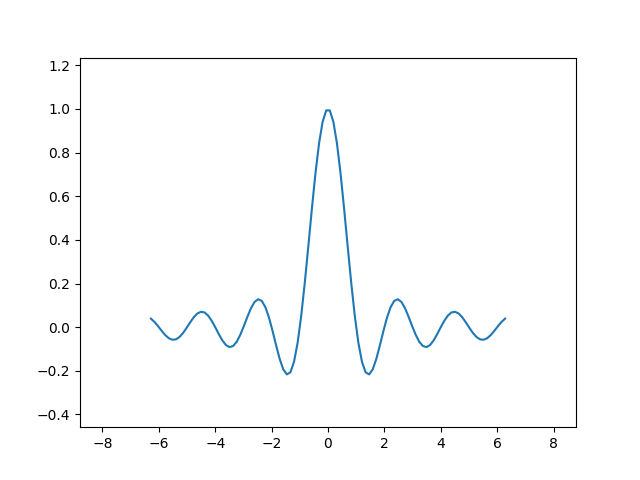
In general, margins can be in the range (-0.5, ∞), where negative margins set
the axes limits to a subrange of the data range, i.e. they clip data.
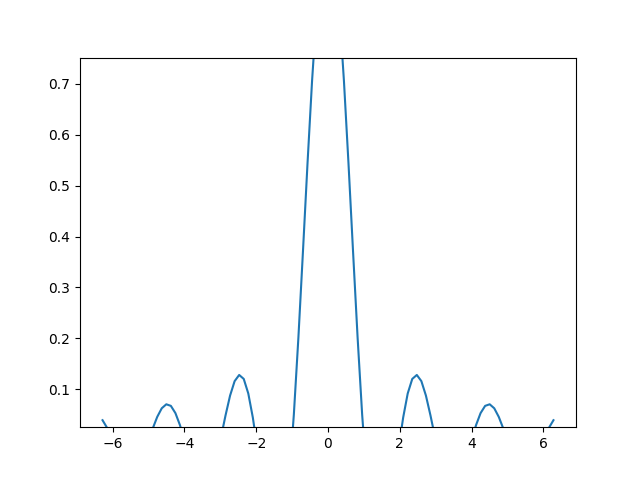
Using a single number for margins affects both axes, a single margin can be
customized using keyword arguments x or y, but positional and keyword
interface cannot be combined.
fig, ax = plt.subplots()
ax.plot(x, y)
ax.margins(y=-0.2)
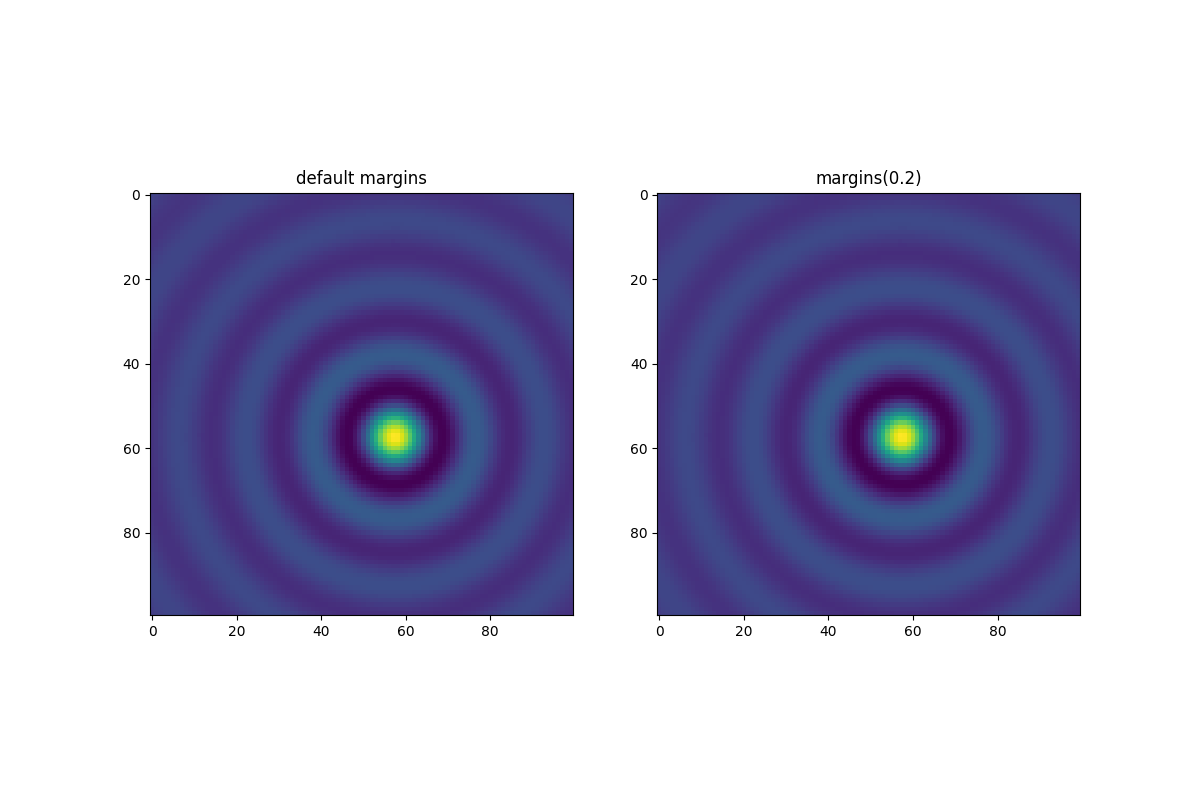
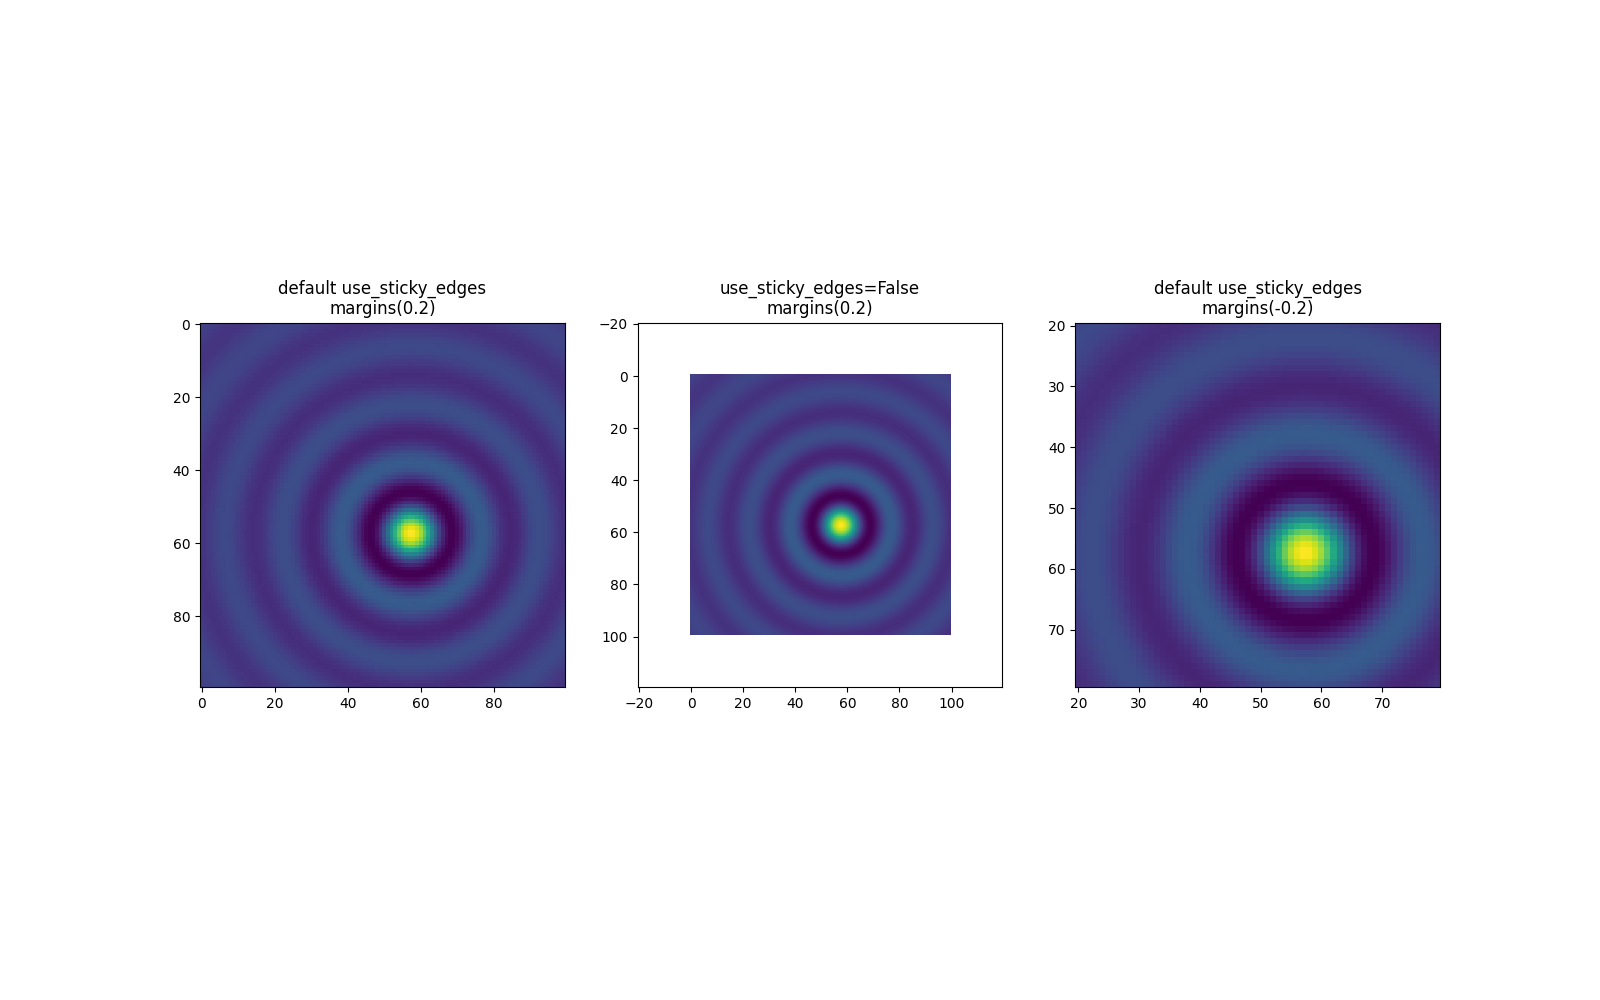
Sticky edges
There are plot elements (Artists) that are usually used without margins.
For example false-color images (e.g. created with Axes.imshow) are not
considered in the margins calculation.
Out:
Text(0.5, 1.0, 'margins(0.2)')
This override of margins is determined by "sticky edges", a
property of Artist class that can suppress adding margins to axis
limits. The effect of sticky edges can be disabled on an Axes by changing
use_sticky_edges.
Artists have a property Artist.sticky_edges, and the values of
sticky edges can be changed by writing to Artist.sticky_edges.x or
.Artist.sticky_edges.y.
The following example shows how overriding works and when it is needed.
fig, ax = plt.subplots(ncols=3, figsize=(16, 10))
ax[0].imshow(zz)
ax[0].margins(0.2)
ax[0].set_title("default use_sticky_edges\nmargins(0.2)")
ax[1].imshow(zz)
ax[1].margins(0.2)
ax[1].use_sticky_edges = False
ax[1].set_title("use_sticky_edges=False\nmargins(0.2)")
ax[2].imshow(zz)
ax[2].margins(-0.2)
ax[2].set_title("default use_sticky_edges\nmargins(-0.2)")
Out:
Text(0.5, 1.0, 'default use_sticky_edges\nmargins(-0.2)')
We can see that setting use_sticky_edges to False renders the image
with requested margins.
While sticky edges don't increase the axis limits through extra margins, negative margins are still taken into account. This can be seen in the reduced limits of the third image.
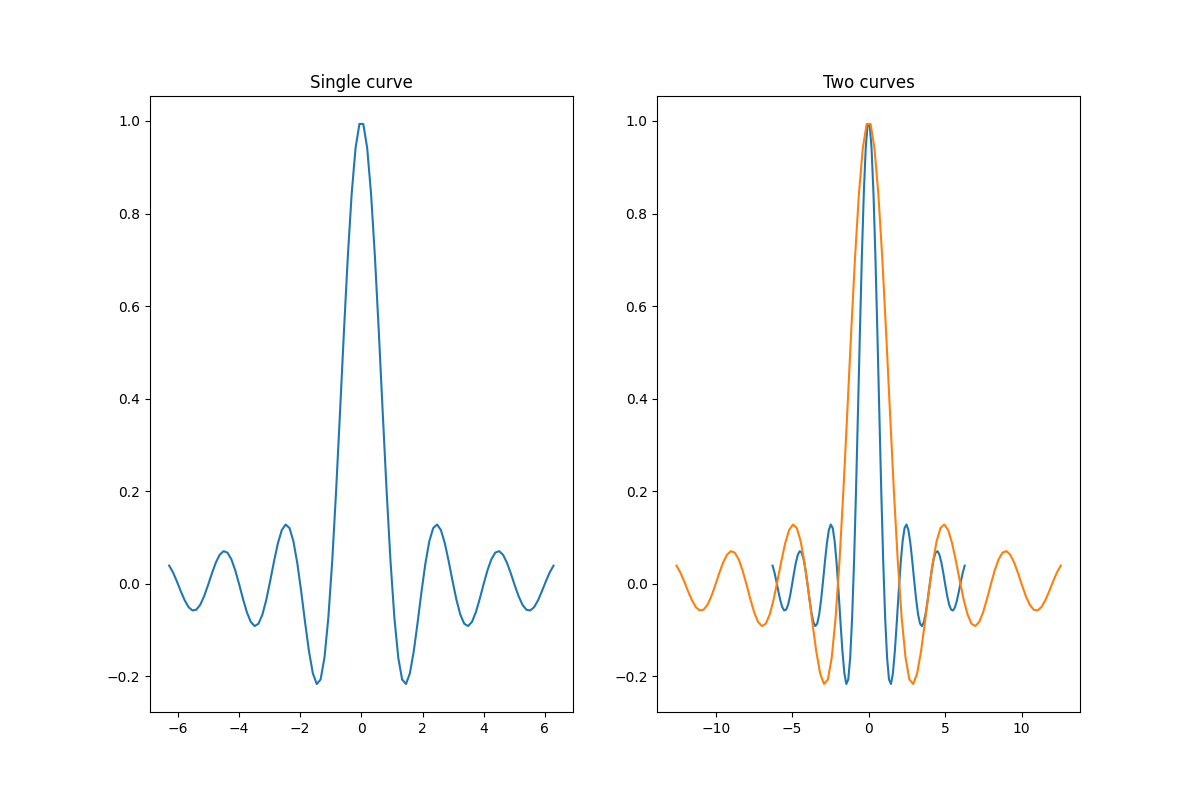
Controlling autoscale
By default, the limits are recalculated every time you add a new curve to the plot:
Out:
Text(0.5, 1.0, 'Two curves')
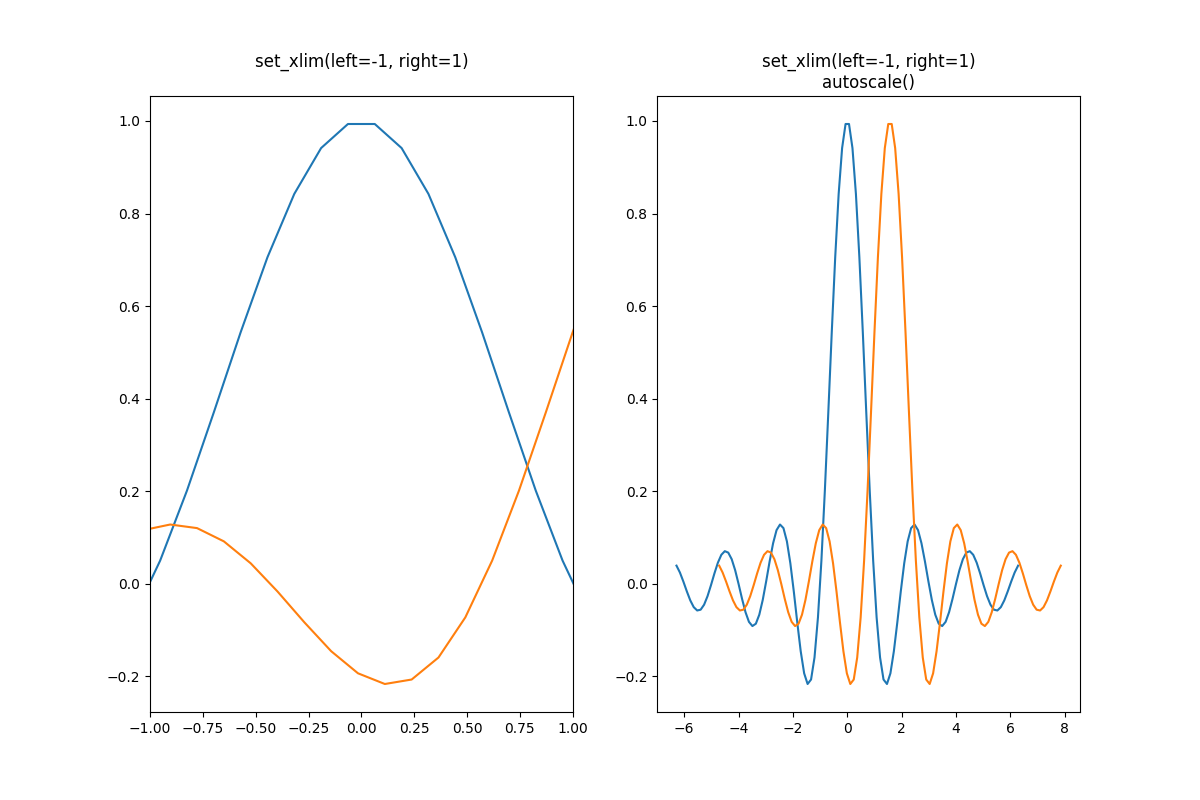
However, there are cases when you don't want to automatically adjust the viewport to new data.
One way to disable autoscaling is to manually set the
axis limit. Let's say that we want to see only a part of the data in
greater detail. Setting the xlim persists even if we add more curves to
the data. To recalculate the new limits calling Axes.autoscale will
toggle the functionality manually.
fig, ax = plt.subplots(ncols=2, figsize=(12, 8))
ax[0].plot(x, y)
ax[0].set_xlim(left=-1, right=1)
ax[0].plot(x + np.pi * 0.5, y)
ax[0].set_title("set_xlim(left=-1, right=1)\n")
ax[1].plot(x, y)
ax[1].set_xlim(left=-1, right=1)
ax[1].plot(x + np.pi * 0.5, y)
ax[1].autoscale()
ax[1].set_title("set_xlim(left=-1, right=1)\nautoscale()")
Out:
Text(0.5, 1.0, 'set_xlim(left=-1, right=1)\nautoscale()')
We can check that the first plot has autoscale disabled and that the second
plot has it enabled again by using Axes.get_autoscale_on():
print(ax[0].get_autoscale_on())  # False means disabled
print(ax[1].get_autoscale_on())  # True means enabled -> recalculated
Out:
False
True
Arguments of the autoscale function give us precise control over the process
of autoscaling. A combination of arguments enable, and axis sets the
autoscaling feature for the selected axis (or both). The argument tight
sets the margin of the selected axis to zero. To preserve settings of either
enable or tight you can set the opposite one to None, that way
it should not be modified. However, setting enable to None and tight
to True affects both axes regardless of the axis argument.
fig, ax = plt.subplots()
ax.plot(x, y)
ax.margins(0.2, 0.2)
ax.autoscale(enable=None, axis="x", tight=True)

print(ax.margins())
Out:
(0, 0)
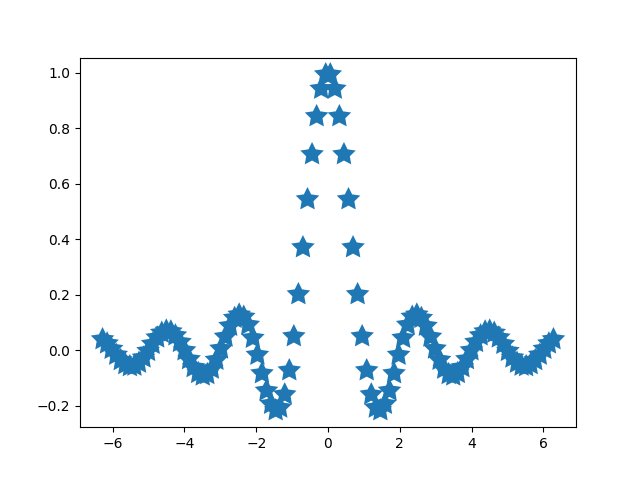
Working with collections
Autoscale works out of the box for all lines, patches, and images added to
the axes. One of the artists that it won't work with is a Collection.
After adding a collection to the axes, one has to manually trigger the
autoscale_view() to recalculate
axes limits.
fig, ax = plt.subplots()
collection = mpl.collections.StarPolygonCollection(
    5, 0, [250, ],  # five point star, zero angle, size 250px
    offsets=np.column_stack([x, y]),  # Set the positions
    transOffset=ax.transData,  # Propagate transformations of the Axes
)
ax.add_collection(collection)
ax.autoscale_view()
Total running time of the script: ( 0 minutes 5.555 seconds)
Keywords: matplotlib code example, codex, python plot, pyplot Gallery generated by Sphinx-Gallery